Impact of aerodynamic properties on carsim & trucksim simulations
Author – Xitadel CAE Technologies India Private Limited & AirShaper
Introduction
Aerodynamics are crucial to many industries and to the transportation industry in particular. Not only are aerodynamics responsible for over half the fuel/power consumption at highway speeds, but they also greatly impact the stability of vehicles under windy conditions or travelling at high speeds. With passenger safety at stake, understanding and optimizing the aerodynamics of vehicles is crucial, whether it concerns cars, trucks or bikes.
In this document, two of the most relevant cases where aerodynamics impact vehicle performance & safety are analyzed:
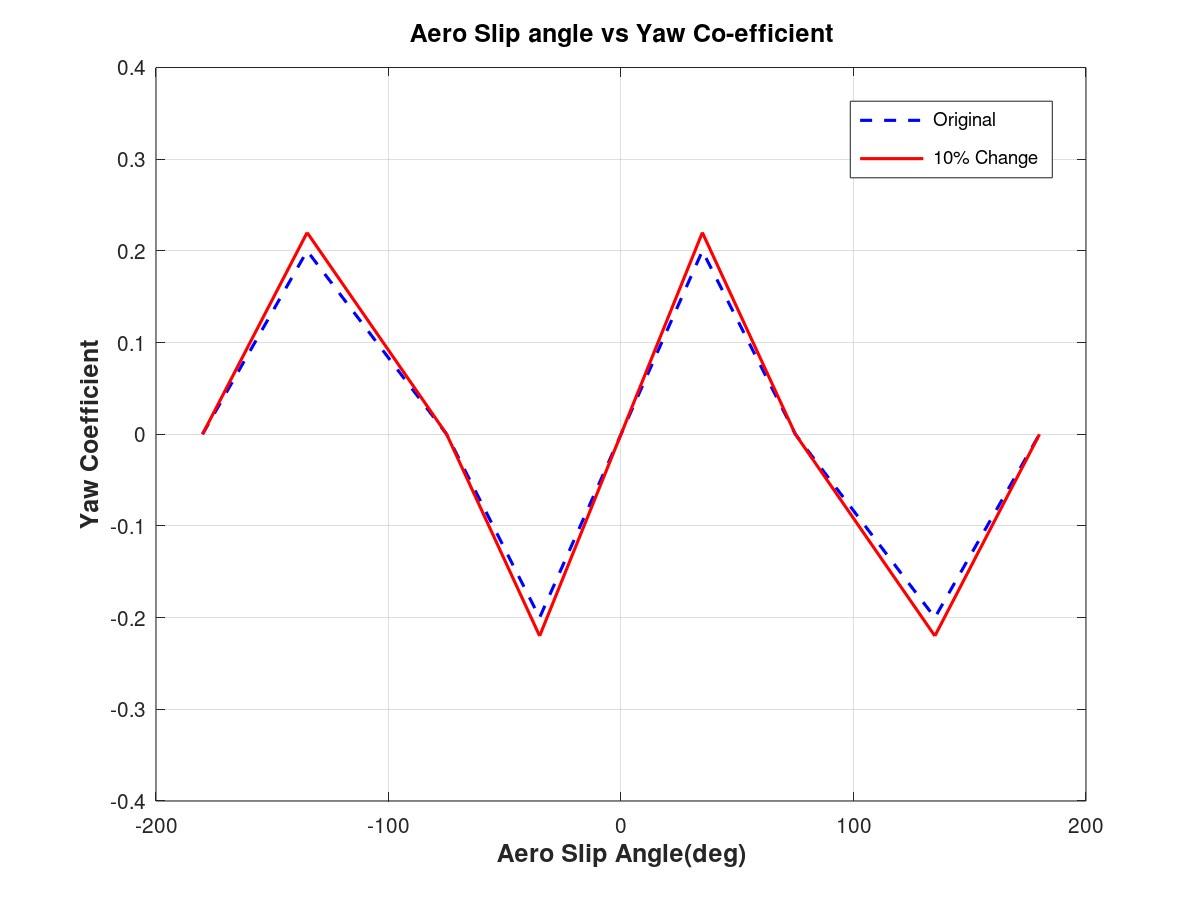
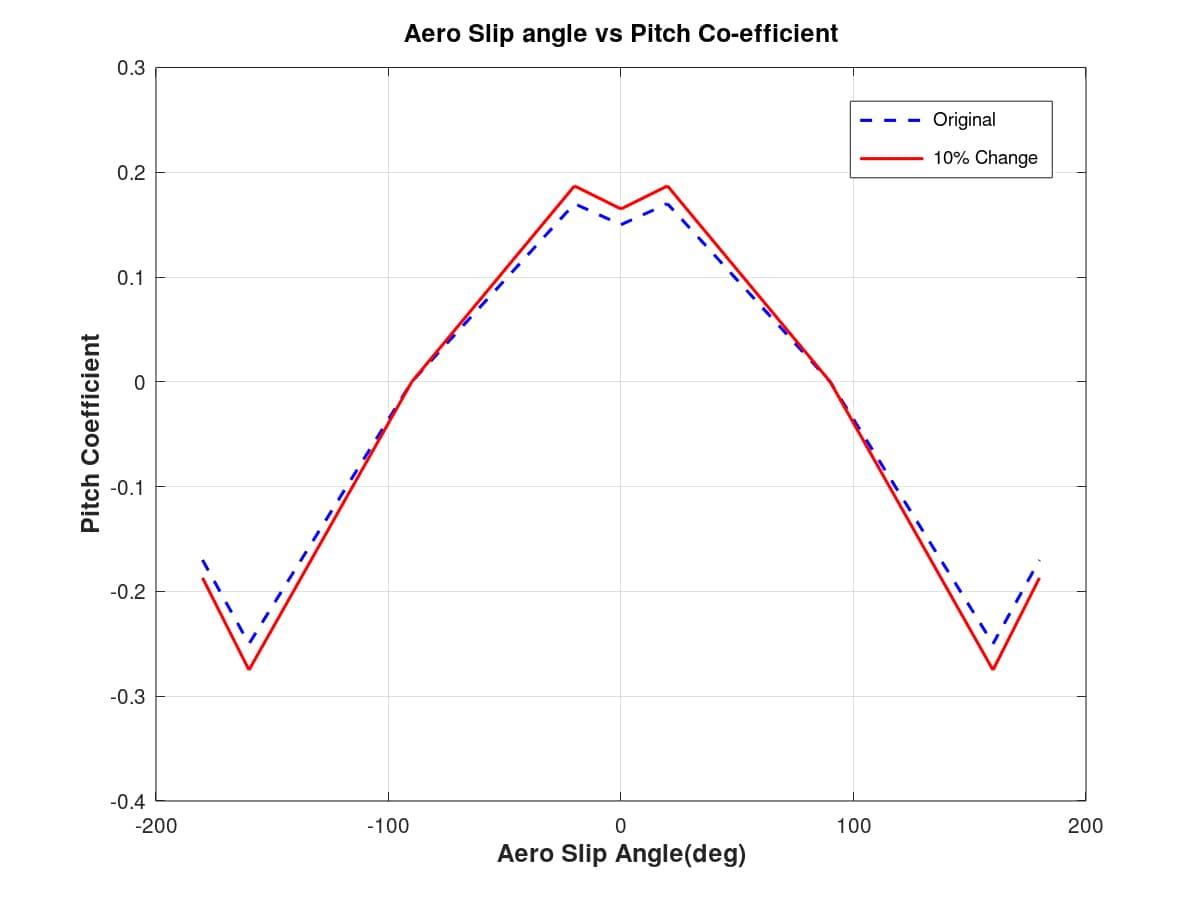
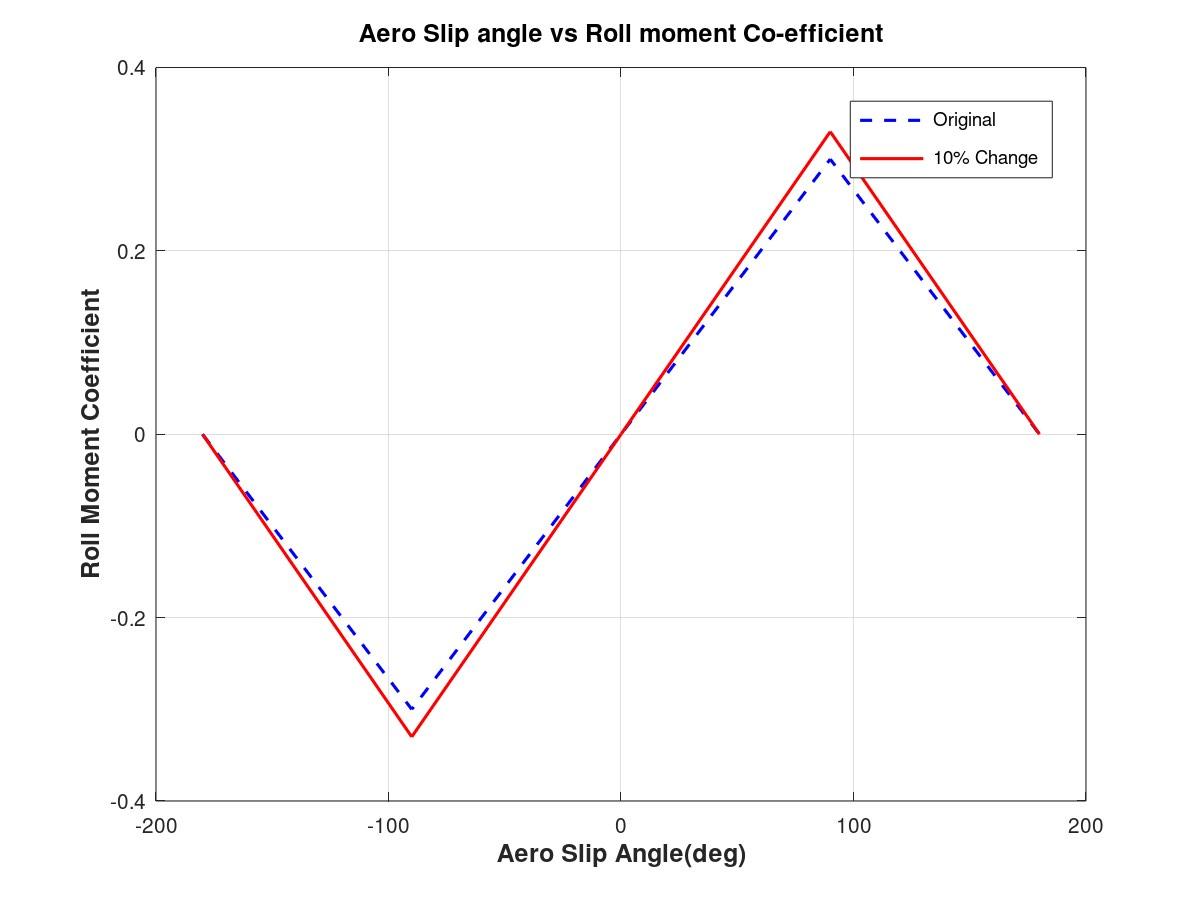
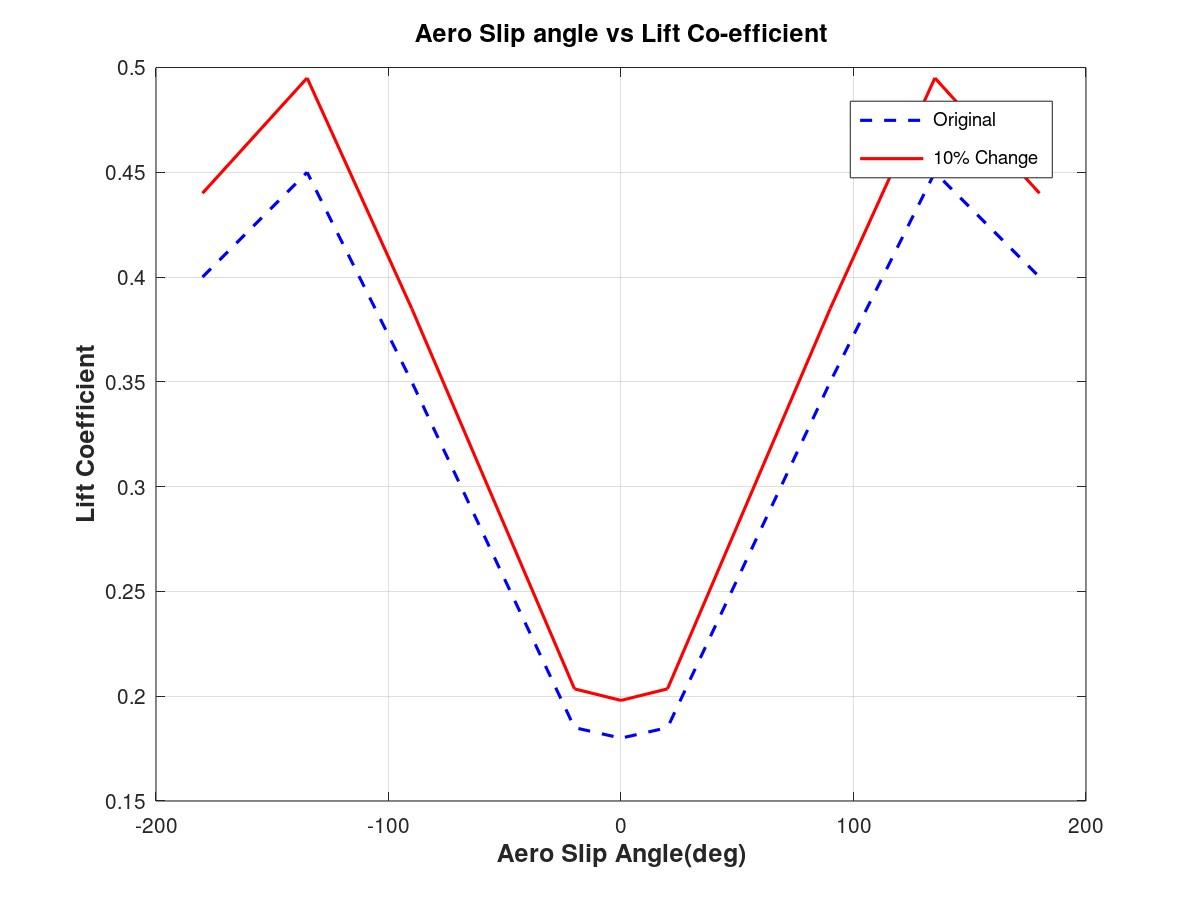
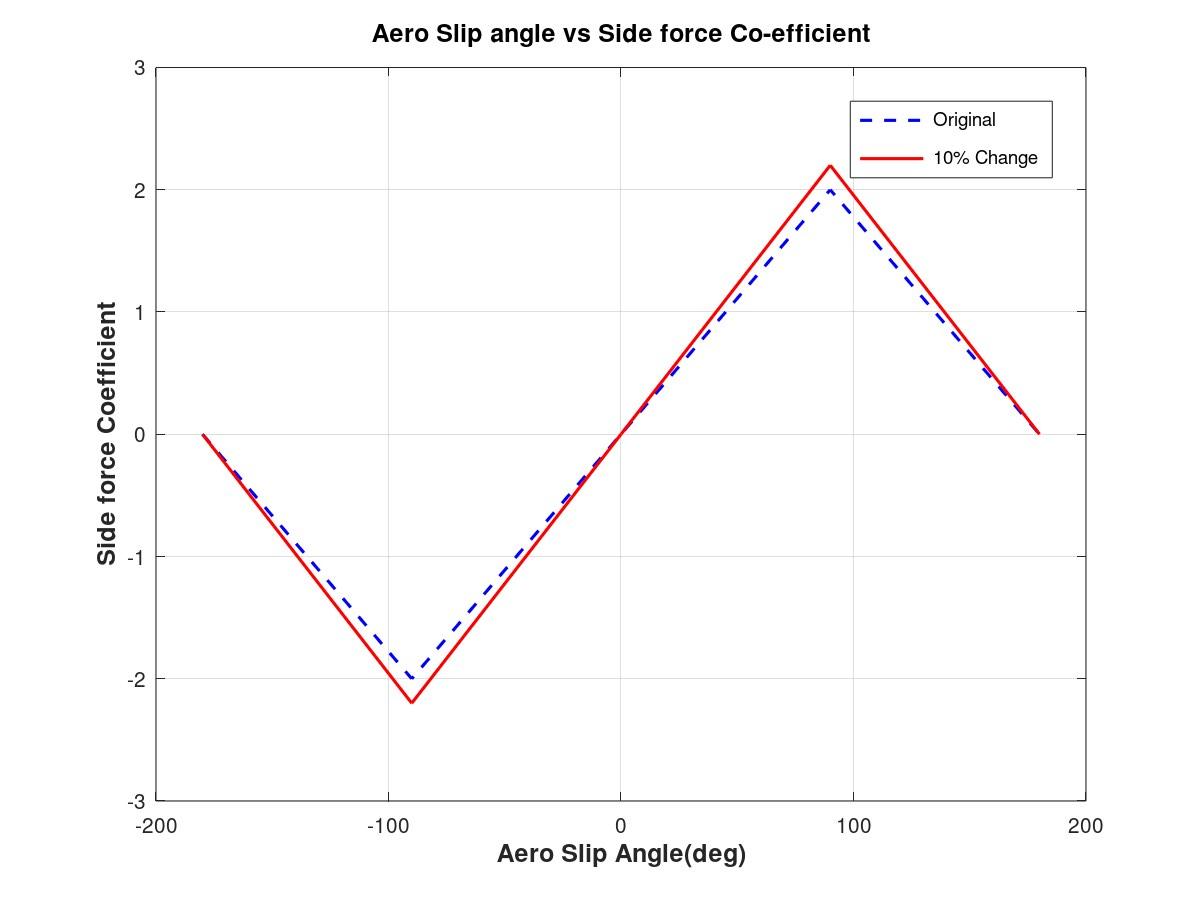
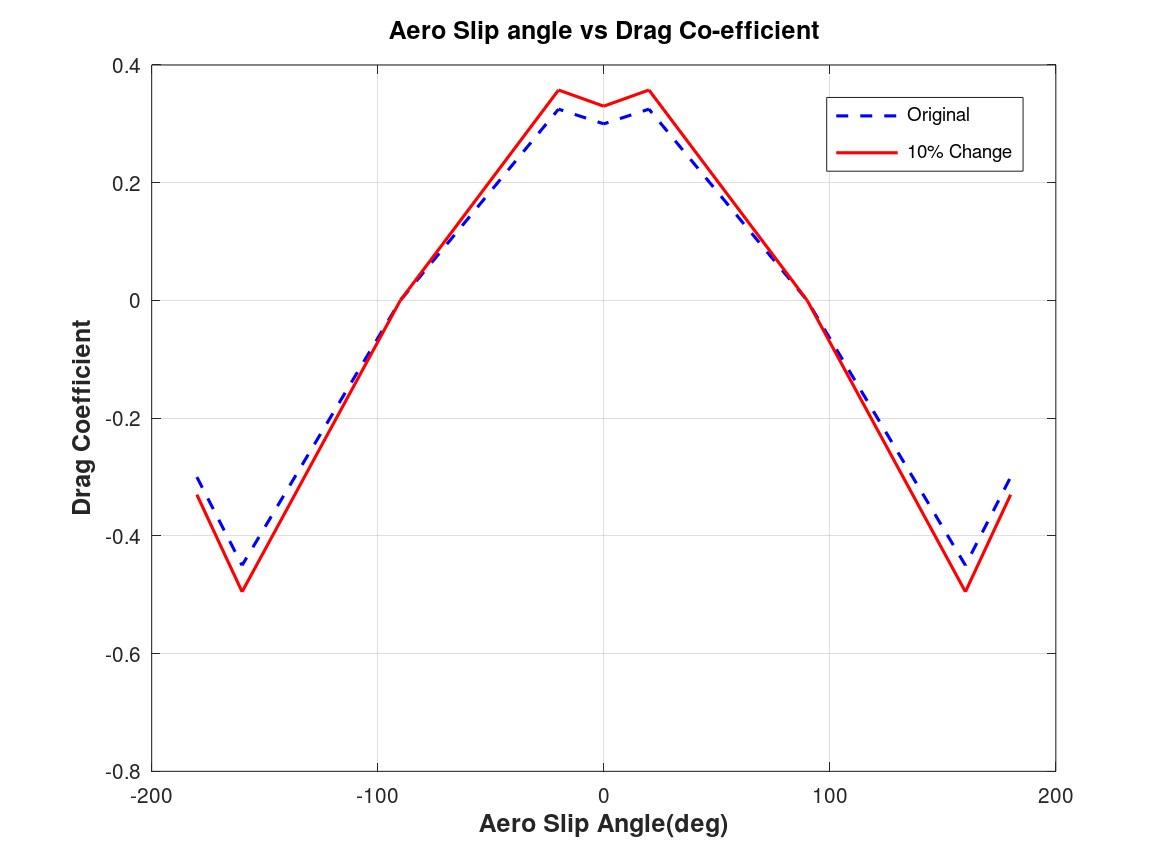
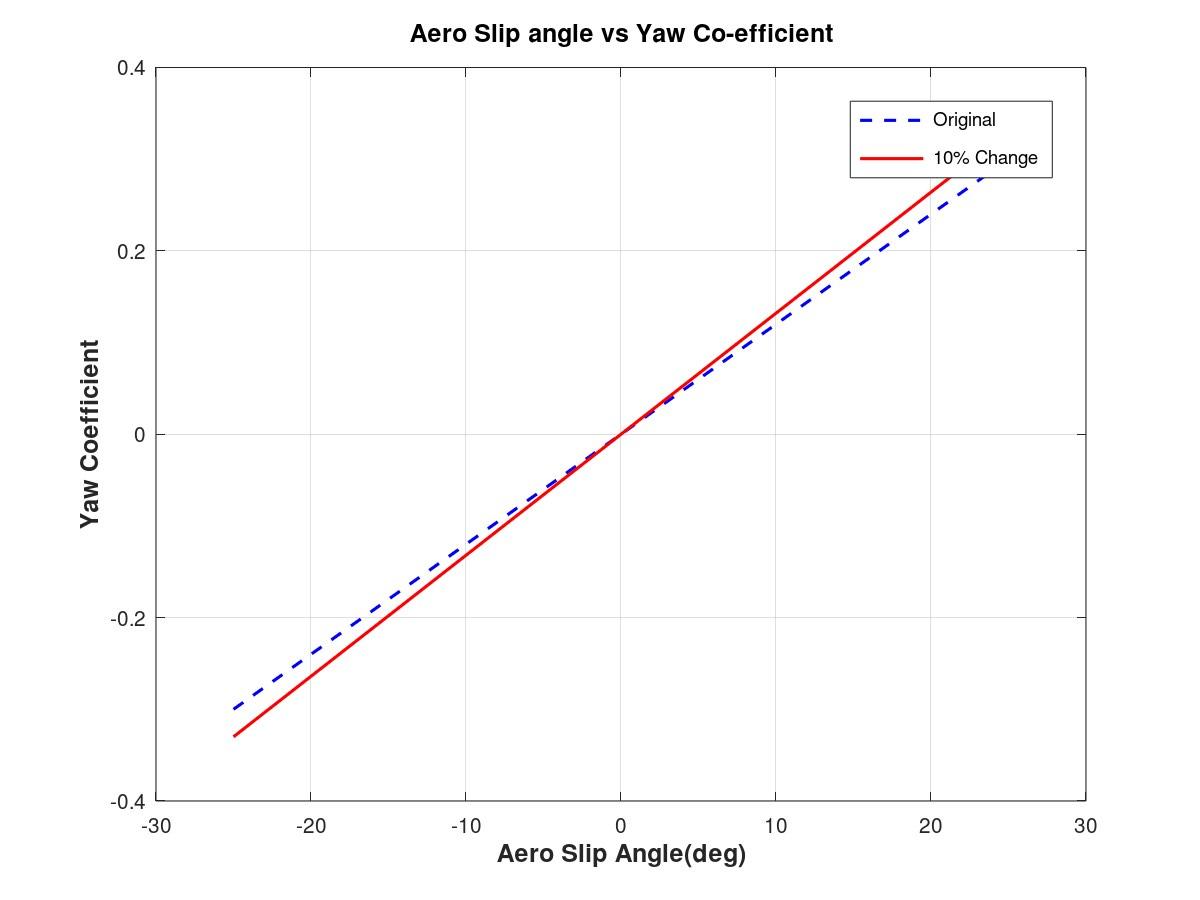
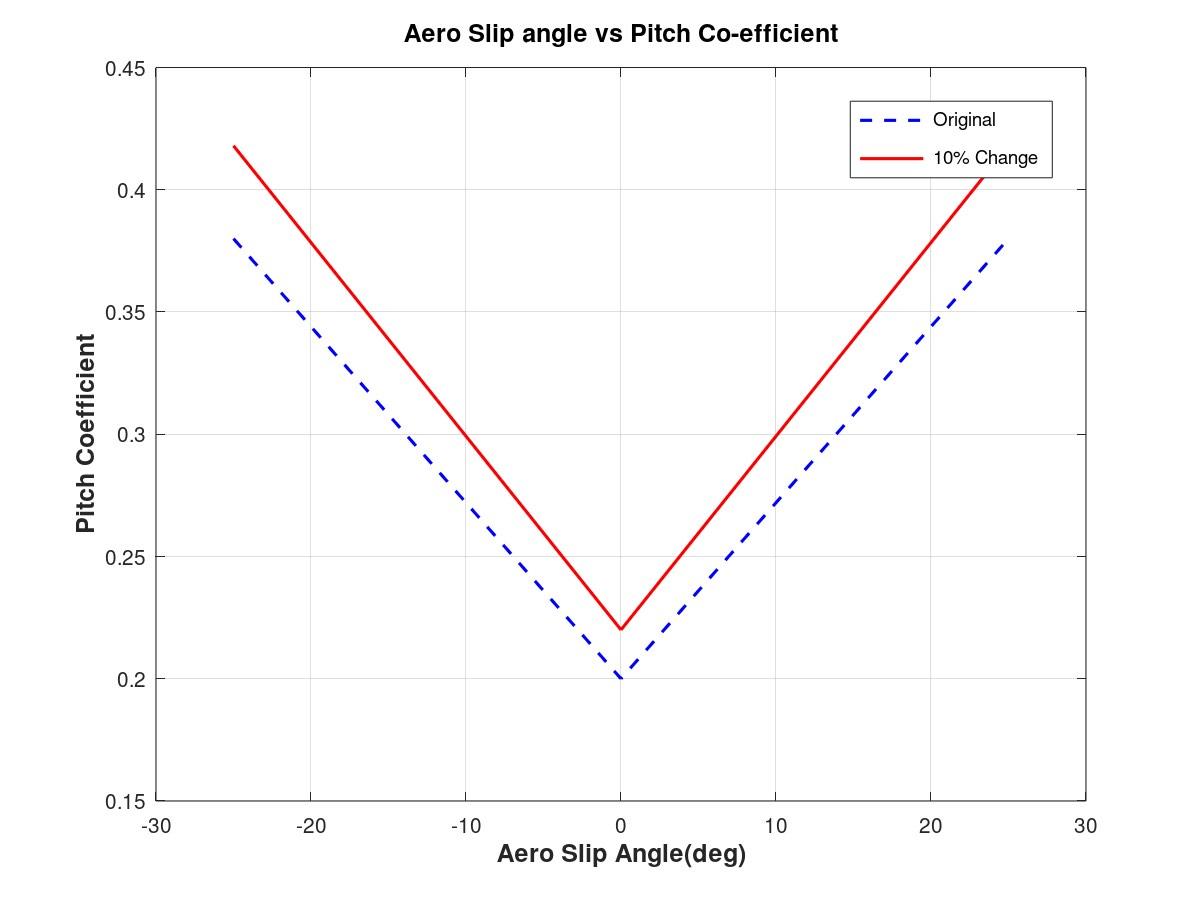
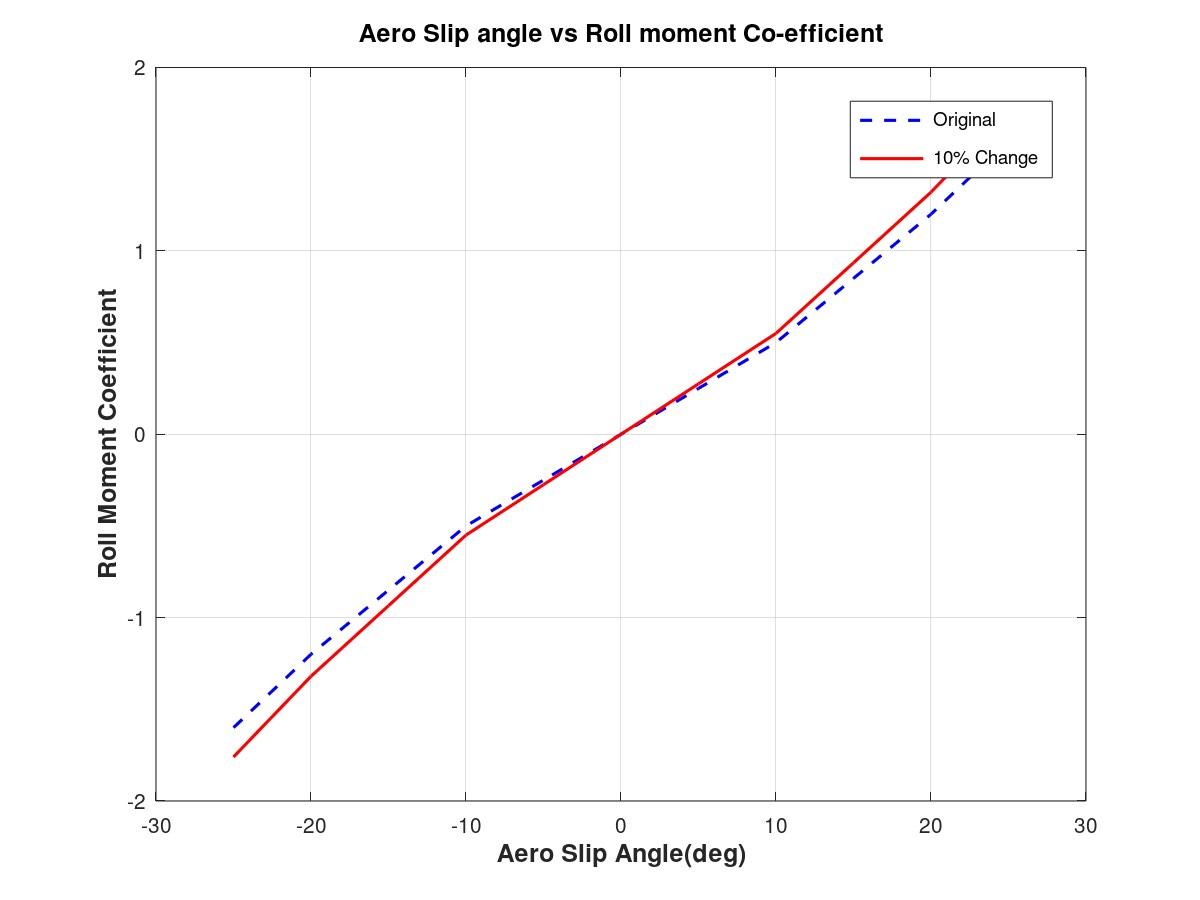
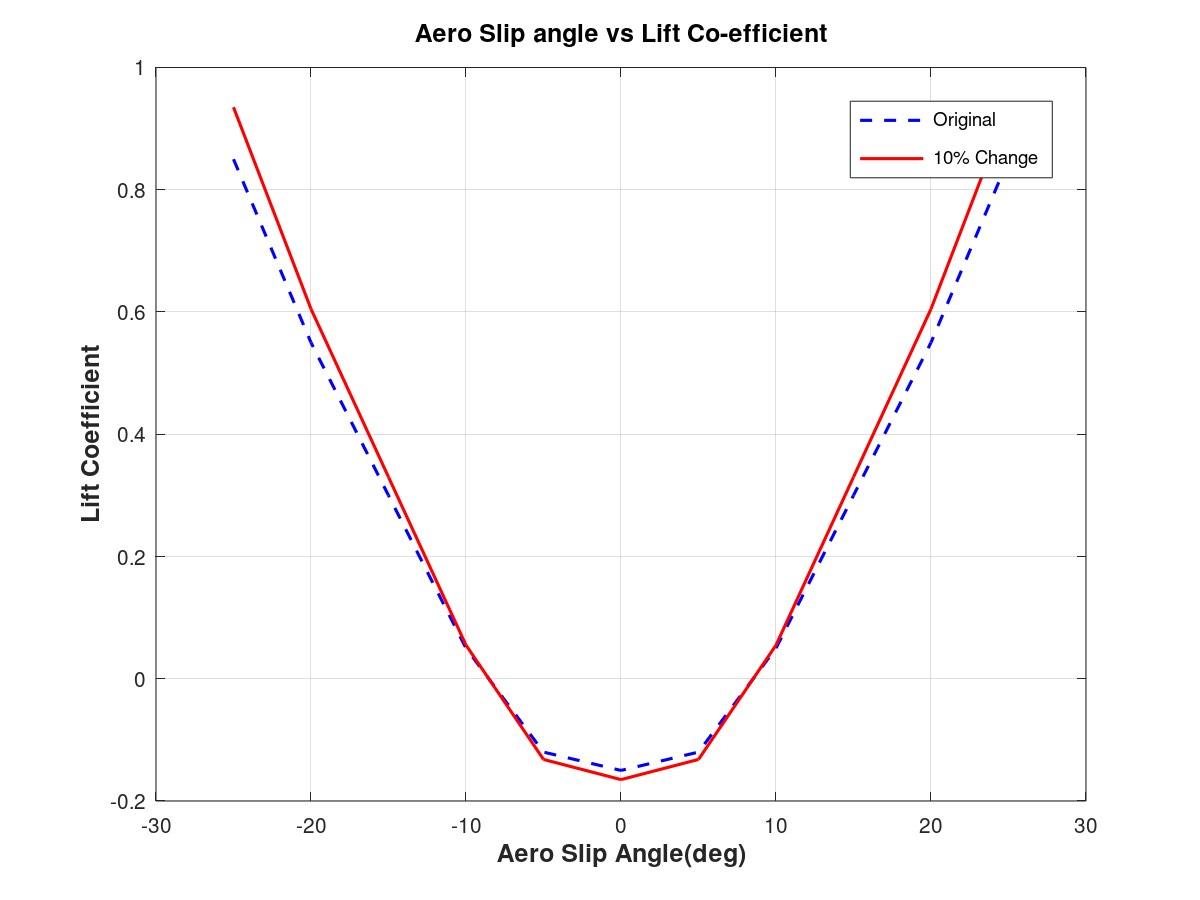
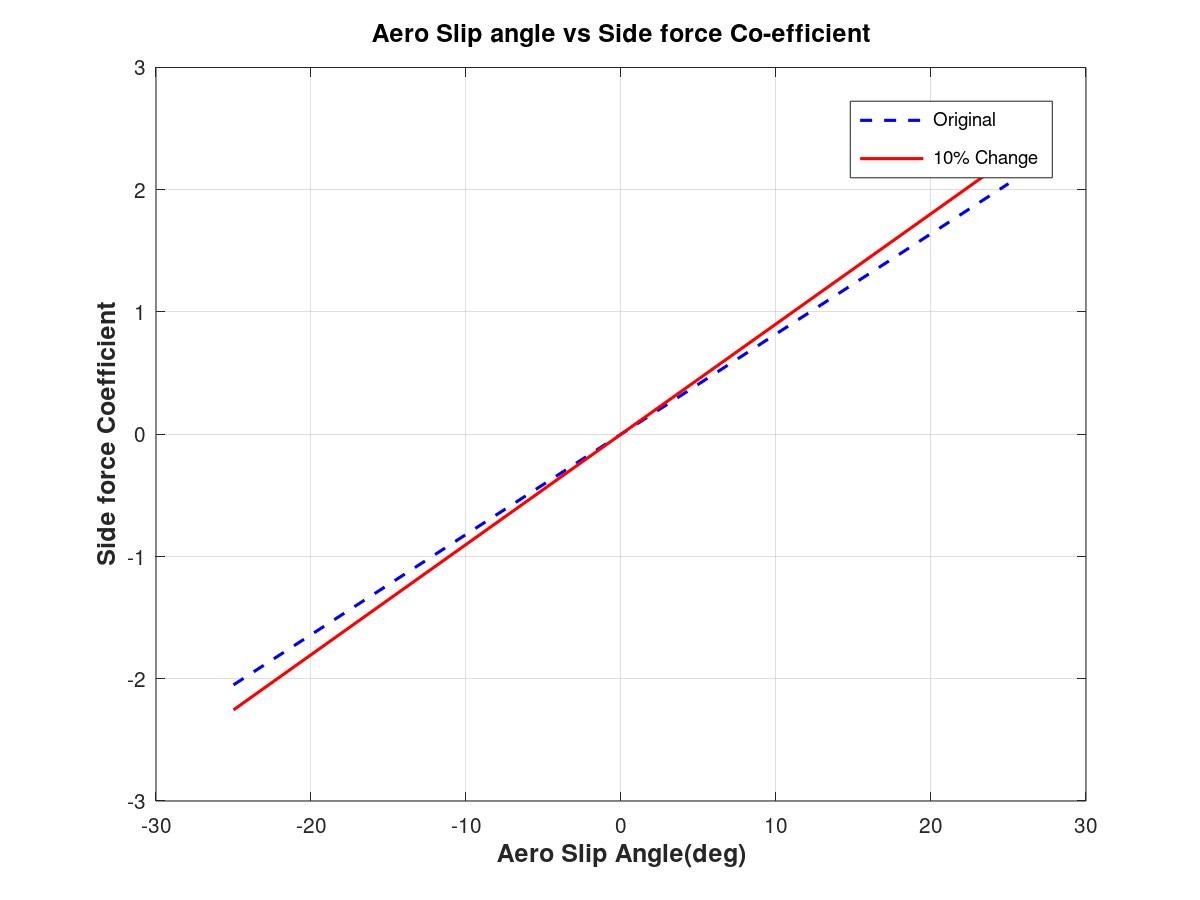
- Sidewind sensitivity: in the first case, the effects of a sudden sidewind are studied. Sidewinds cause both aerodynamic forces & aerodynamic moments on the vehicle. The magnitude of these forces depends on the aerodynamic coefficients of the vehicle (which, in turn, depend on the geometry of the vehicle). To indicate the sensitivity to these coefficients, they were increased by 10% to analyze the effect on vehicle stability. The result on vehicle stability & safety can clearly be observed by analyzing steering wheel angle torque, roll angle, and so on.
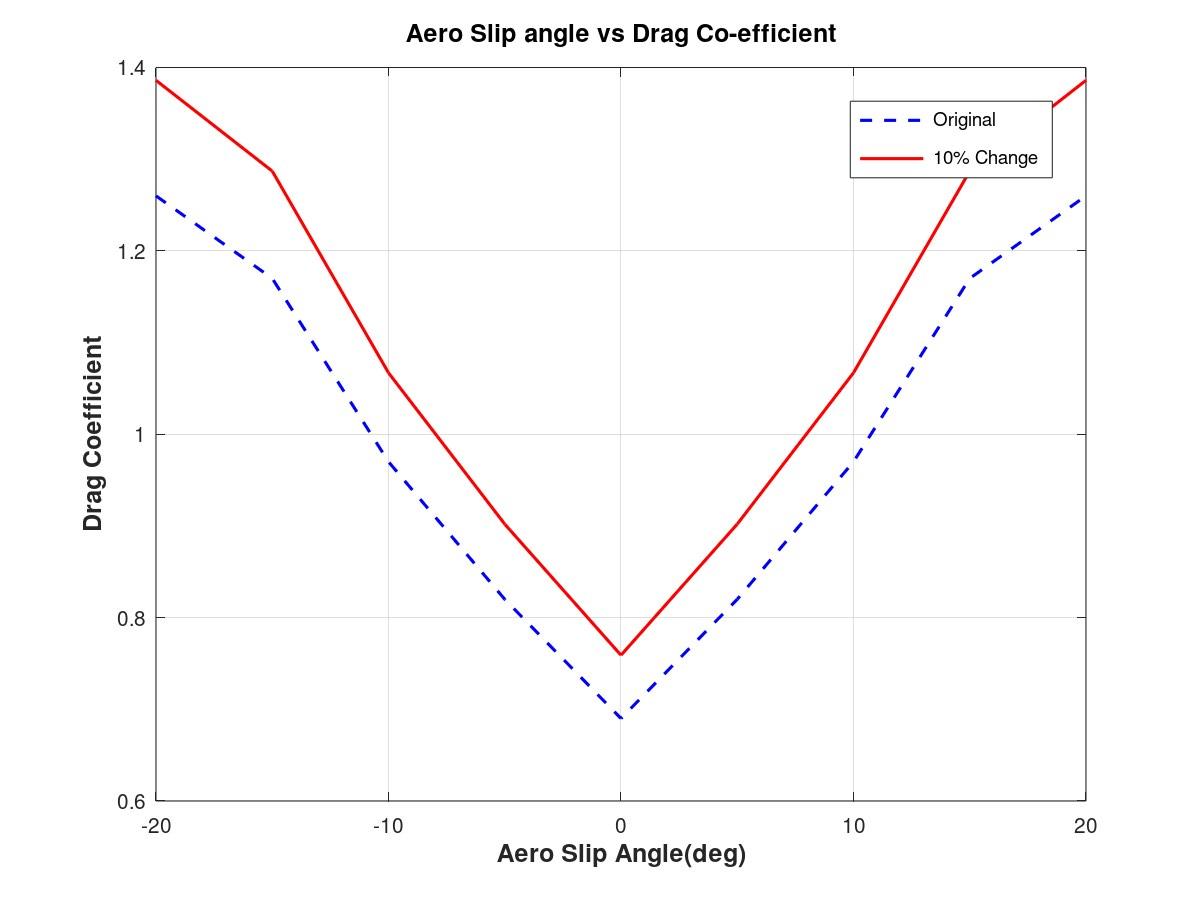
- Fuel consumption: as mentioned, aerodynamic drag is responsible for well over 50% of the required power (and thus fuel) to keep a vehicle moving at highway speeds. In this scenario, the vehicle virtually performs the EPA Highway Fuel Economy Test Cycle. Again, the aerodynamic coefficients were increased by 10% to illustrate the sensitivity of the end result (fuel/battery power consumption) to these parameters. The effect on fuel/energy consumption is very clear and indicates the importance of a streamlined design.
Both of the scenarios above were performed for 2 vehicle types, i.e. a car and a truck, to illustrate the difference in aerodynamic behaviour and the effect on dynamic stability, safety & fuel/energy consumption. The set-up and execution of the simulations in CarSim and TruckSim software were performed by XITADEL CAE Technologies India Private Limited.
In conclusion, the effects of aerodynamics are crucial for amongst others:
- Vehicle stability: side winds can seriously impact the vehicle course. Understanding this impact is crucial for the design of safe vehicles or the design of a controller strategy for an autonomous vehicle.
- Fuel/energy consumption: when simulating the run of a vehicle over a specified driving cycle, the aerodynamic resistance contributes greatly to the fuel/energy consumption, even for the low-speed driving cycle that was applied in this study.
Obtaining accurate aerodynamic coefficients is crucial to running accurate vehicle dynamics simulations. These coefficients can be obtained through CFD (computational fluid dynamics) simulations at AirShper (www.airshaper.com) and/or physical wind tunnel testing.
CarSim Simulations
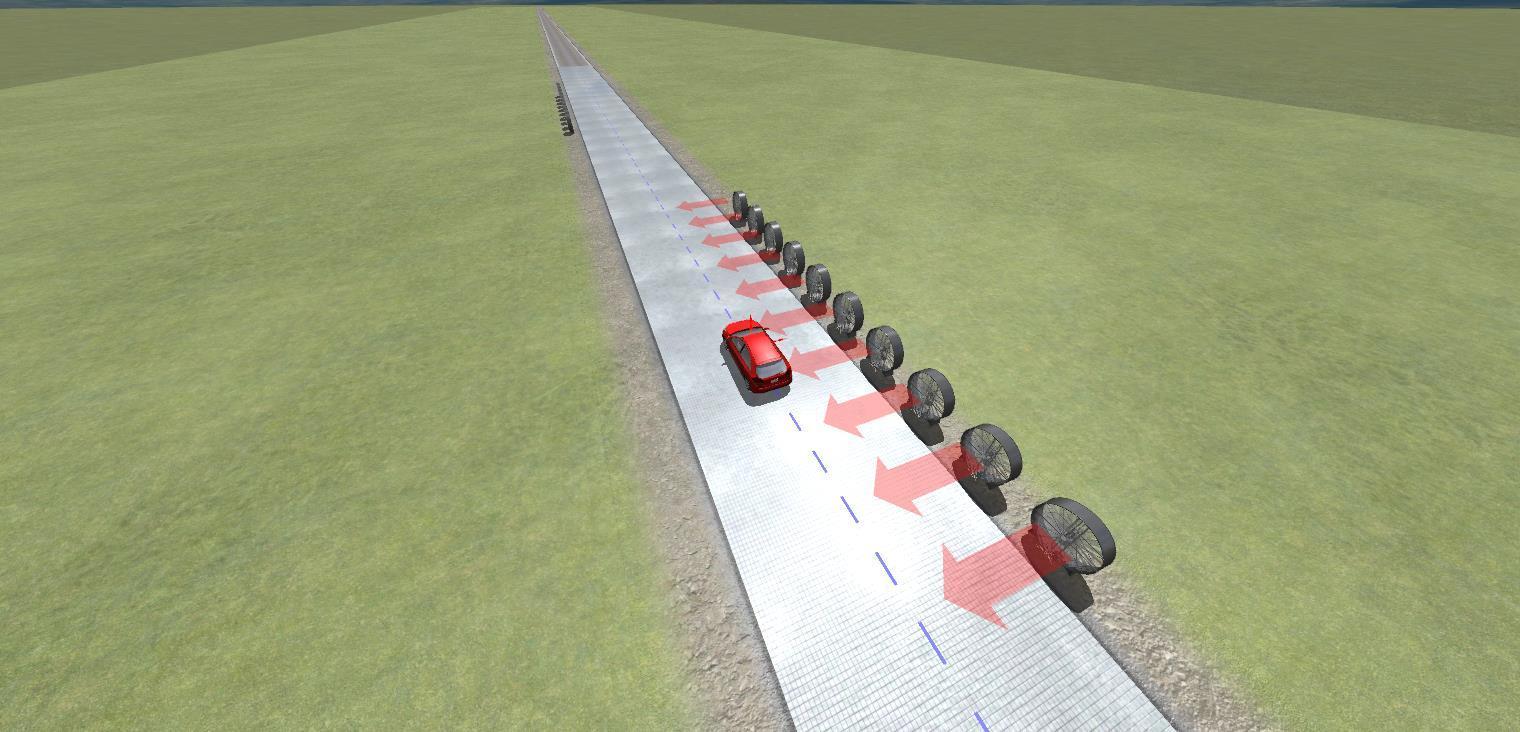
Test Scenario: Crosswind Testing
Set-up:
- Constant vehicle speed of 80 km/hr. on a straight flat road with μ=0.85
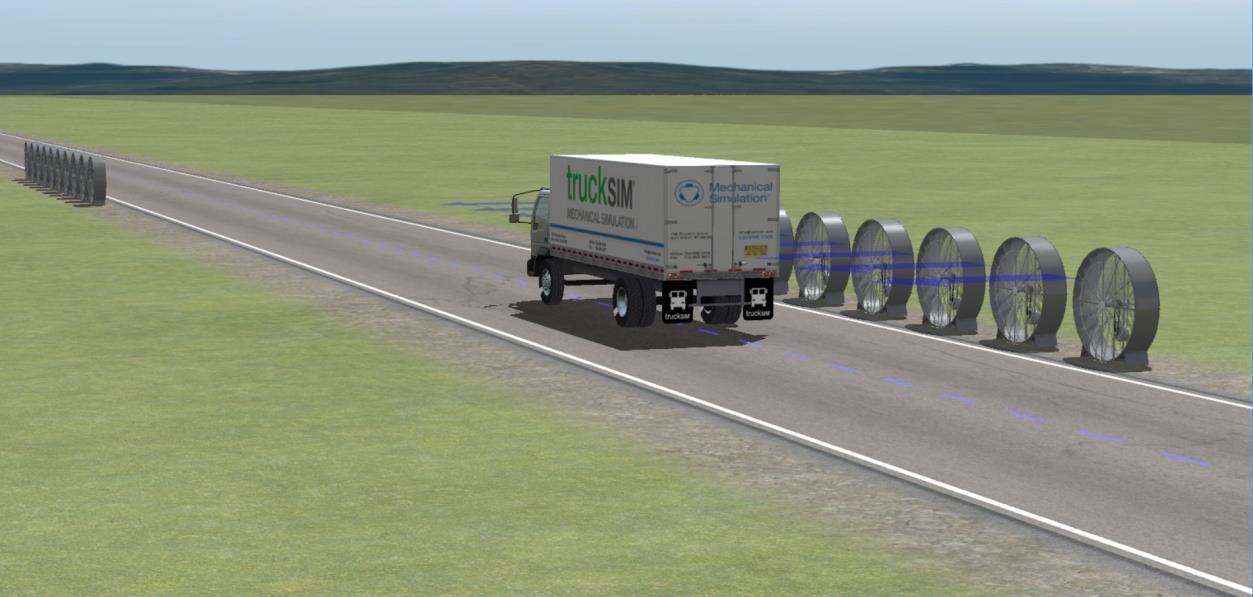
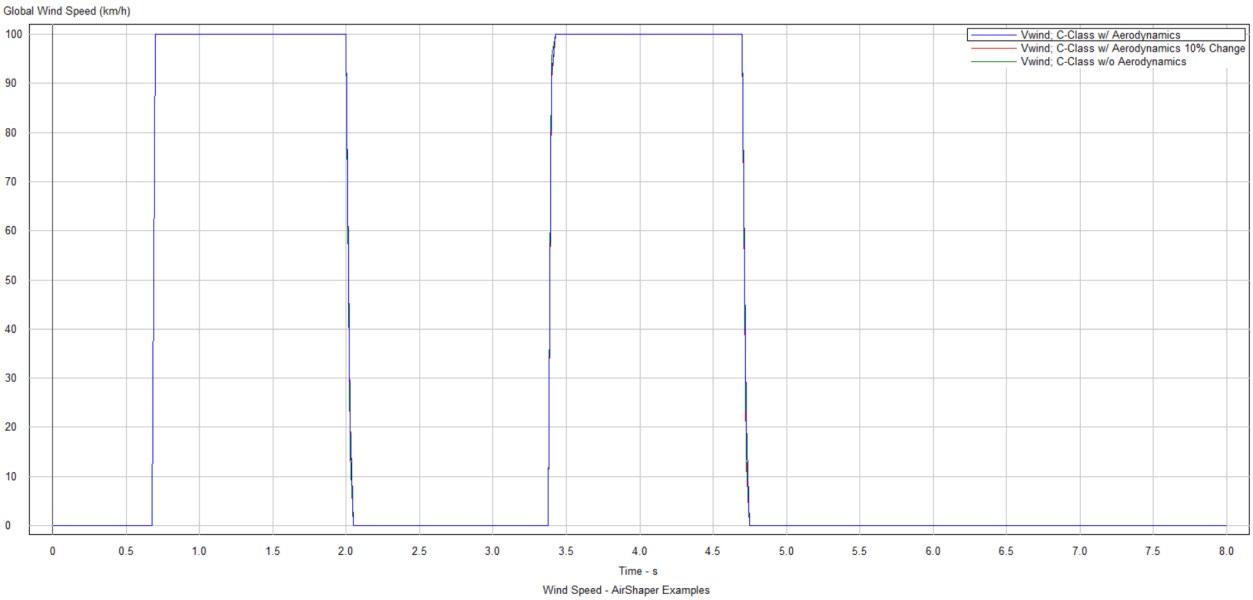
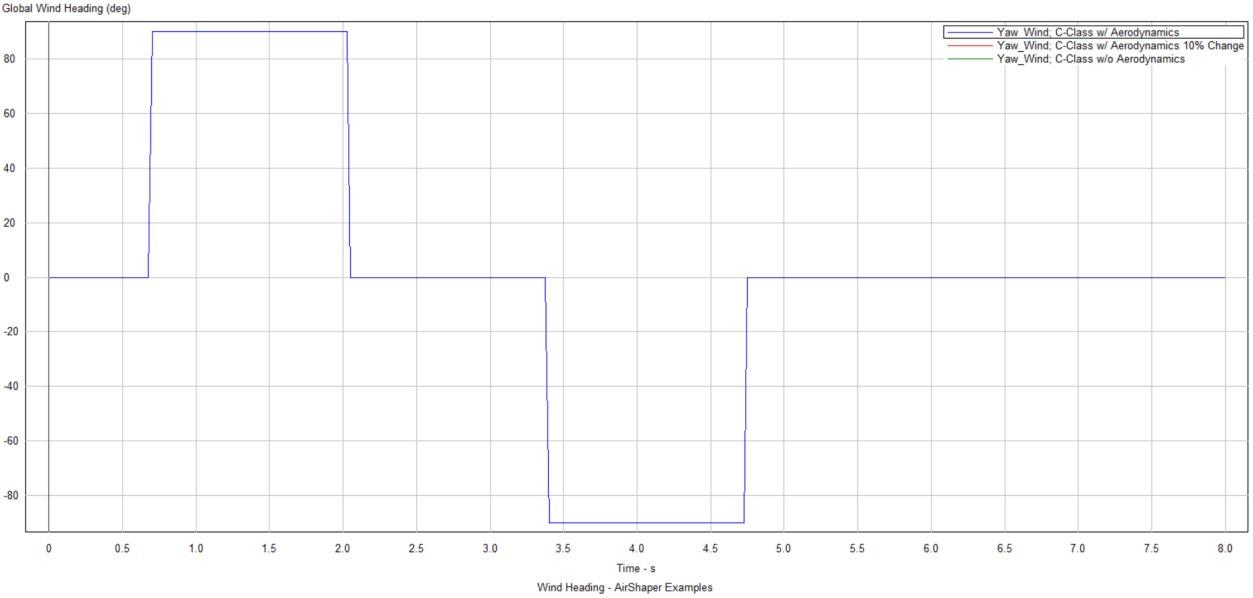
- Crosswind of 100 km/h from the left and right fans as shown in Figure 1
- Parameters like steering wheel angle, yaw rate and lateral acceleration etc. are mapped @ the sprung mass (see section 5.1)
- The simulation was carried out for 2 cases:
- Case 1 – Run cross wind simulations with below set-up
- No Aerodynamics
- With Aerodynamics
- 10% increase for all aerodynamics coefficient
- Case 2 – Run cross wind simulations with below set-up
- No Aerodynamics
- With Aerodynamics
- 10% increase for just the lateral force coefficient
- Case 1 – Run cross wind simulations with below set-up
Reslts
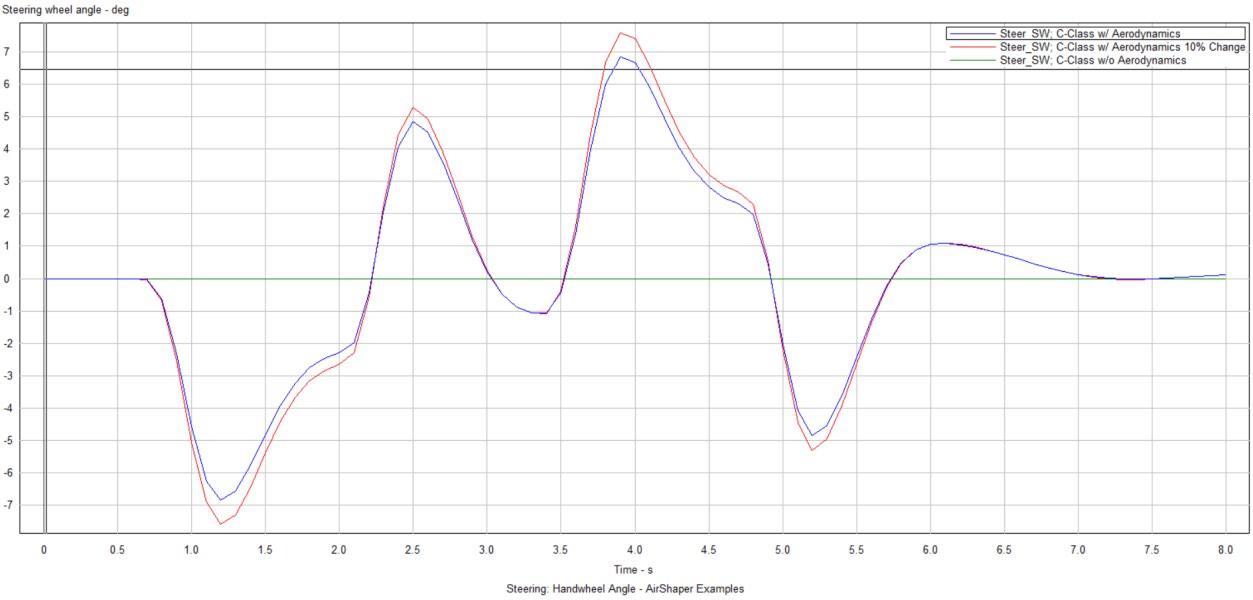
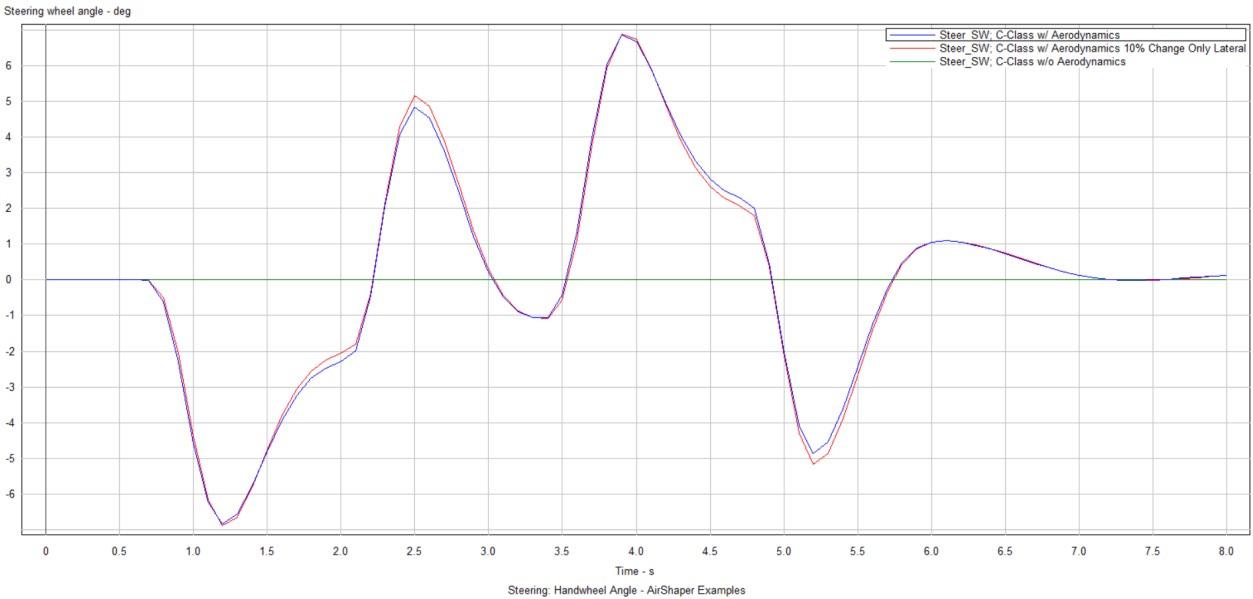
Steering wheel angle deviation
Case 1:
Case 2:
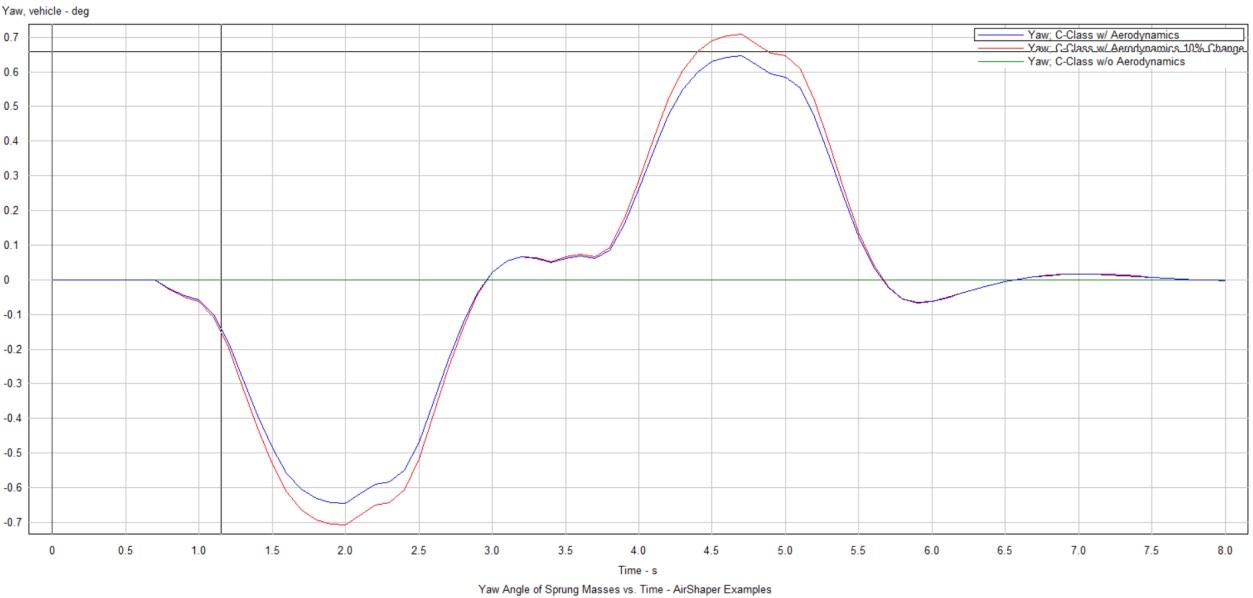
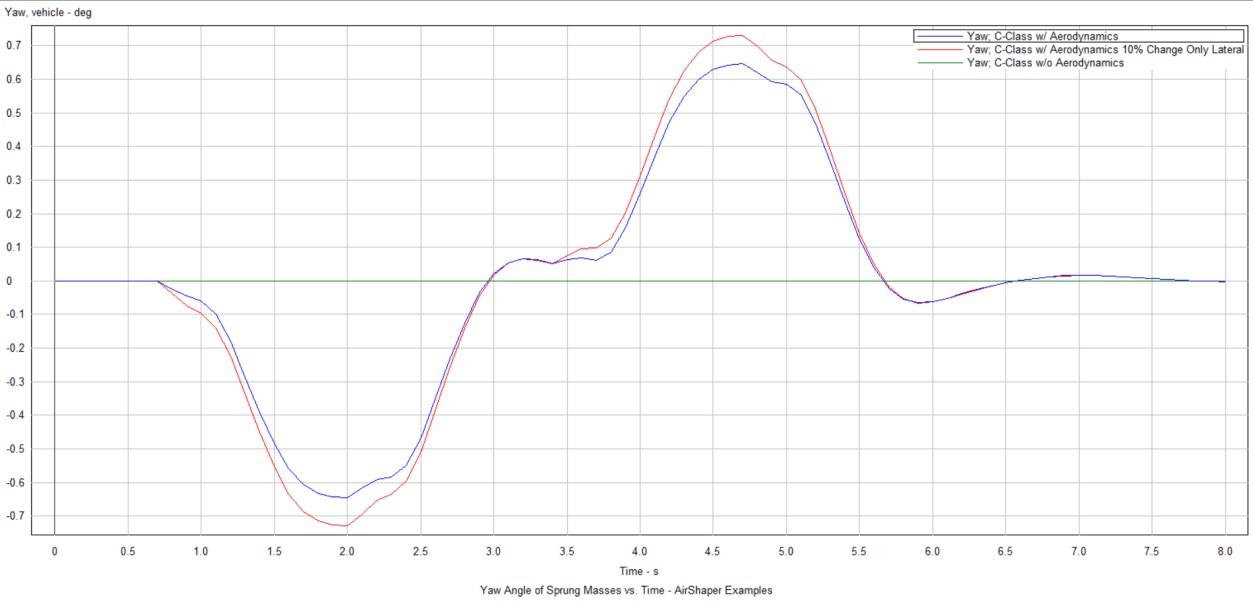
Yaw angle deviation
Case 1:
Case 2:
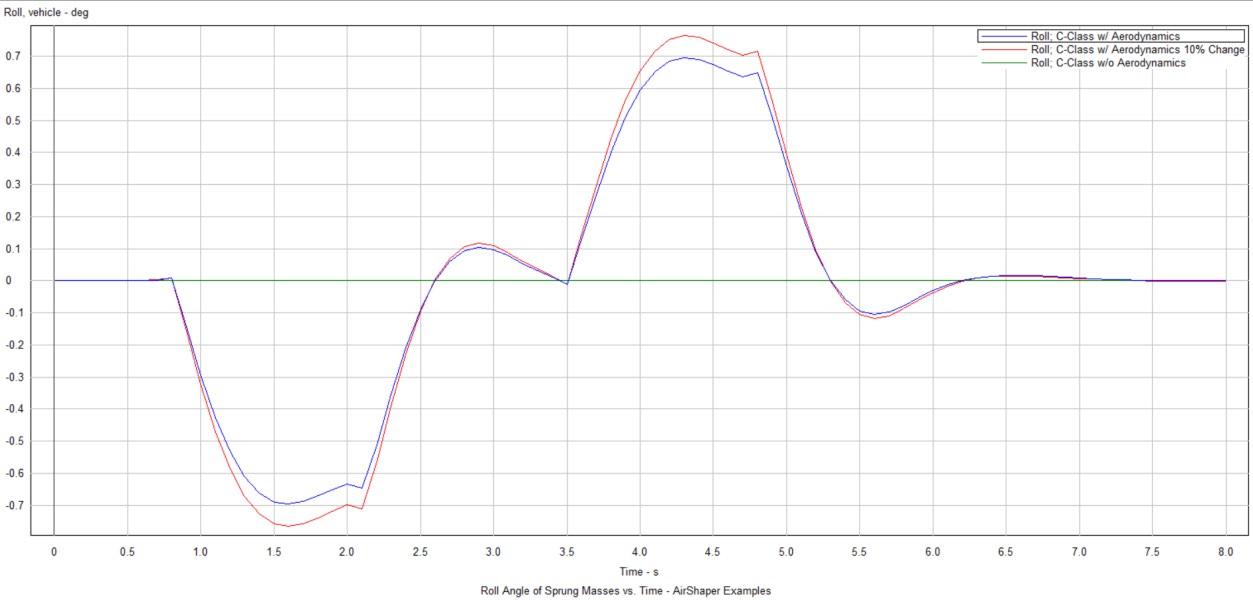
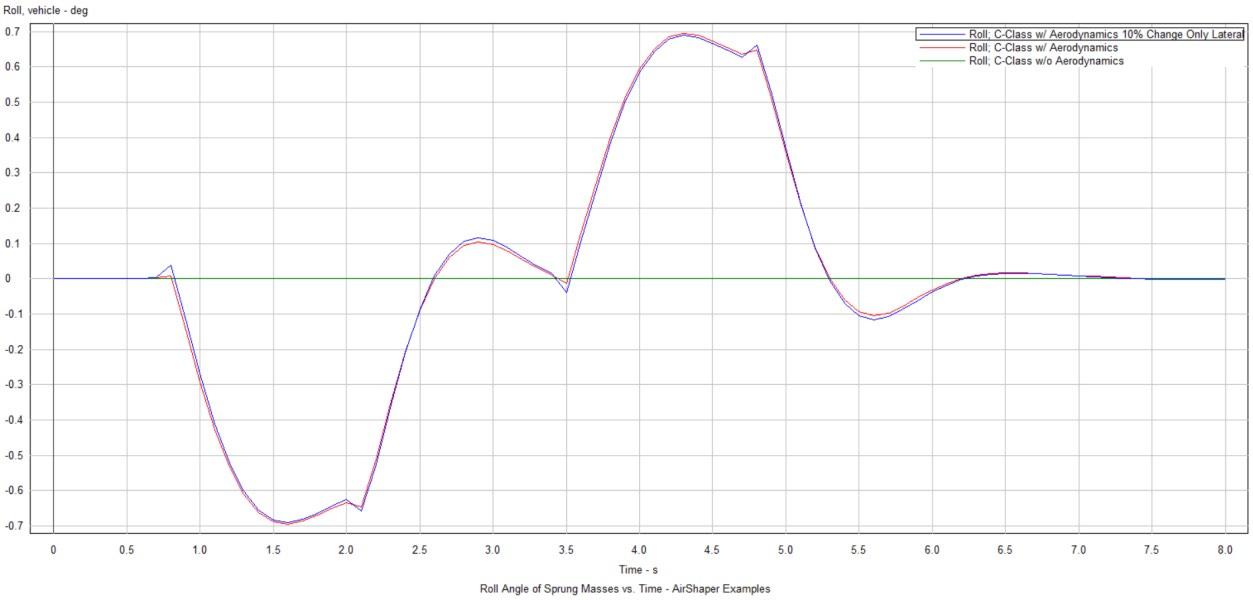
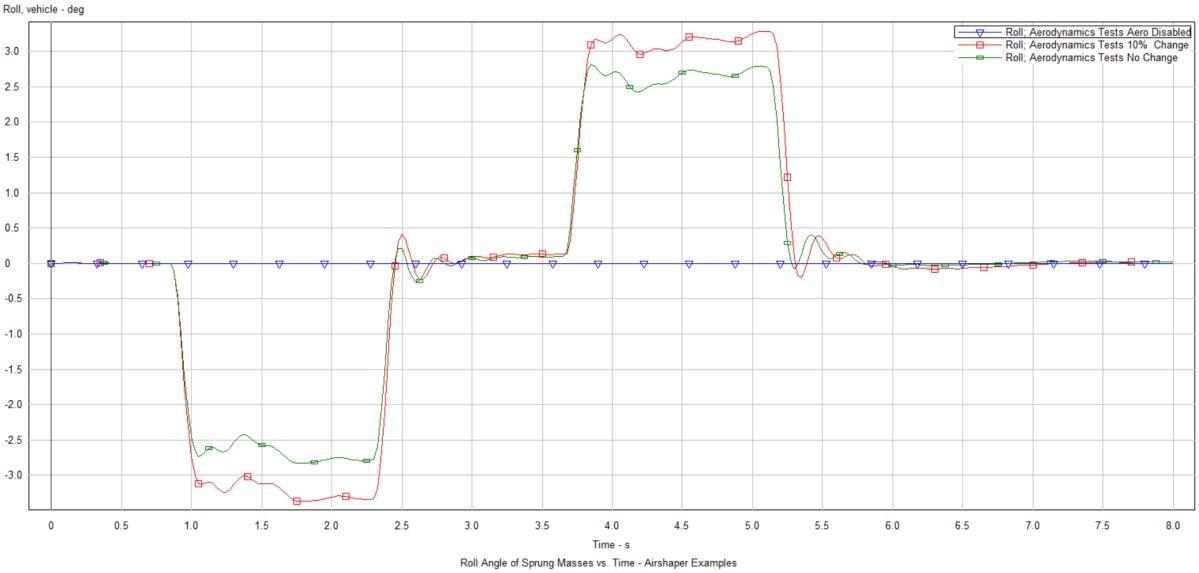
Roll angle variation
Case 1:
Case 2:
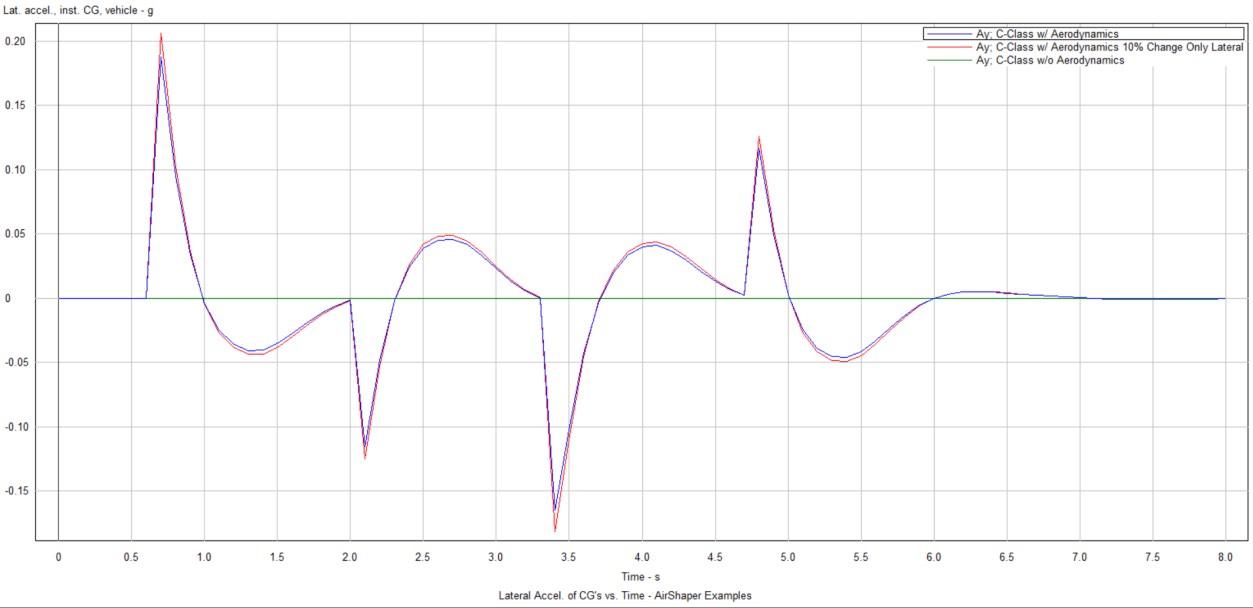
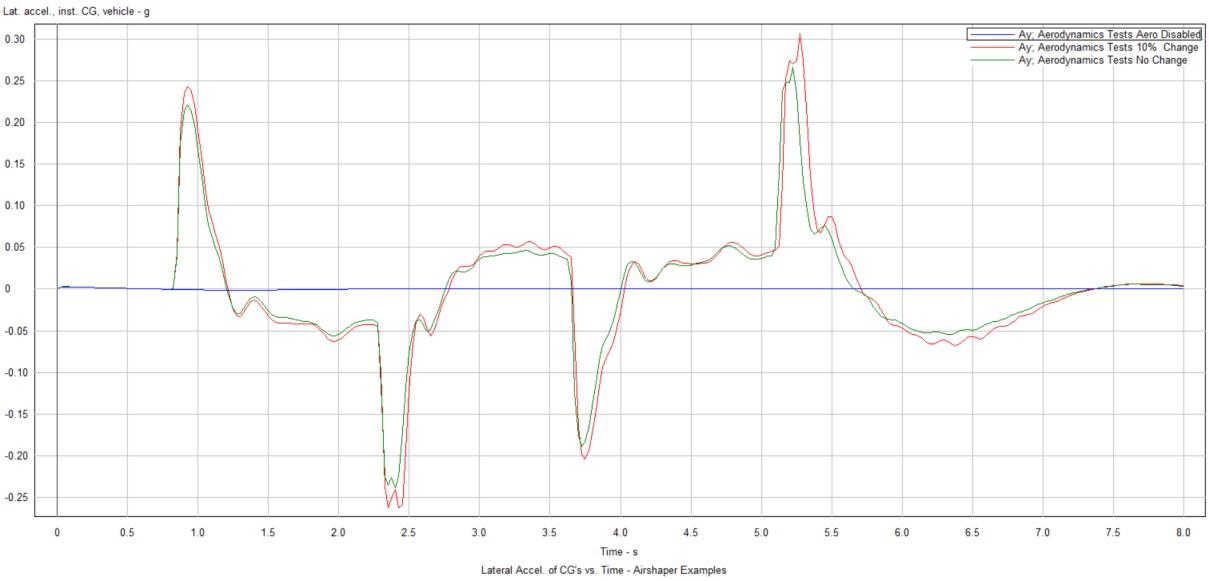
Lateral Acceleration
Case 1:
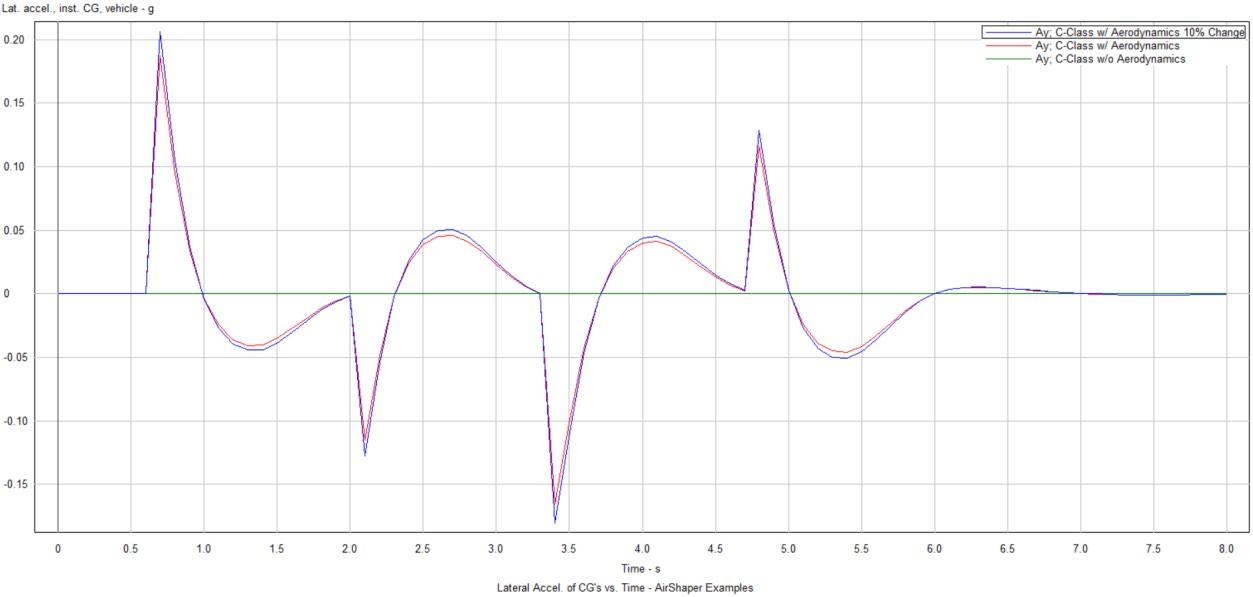
Case 2:
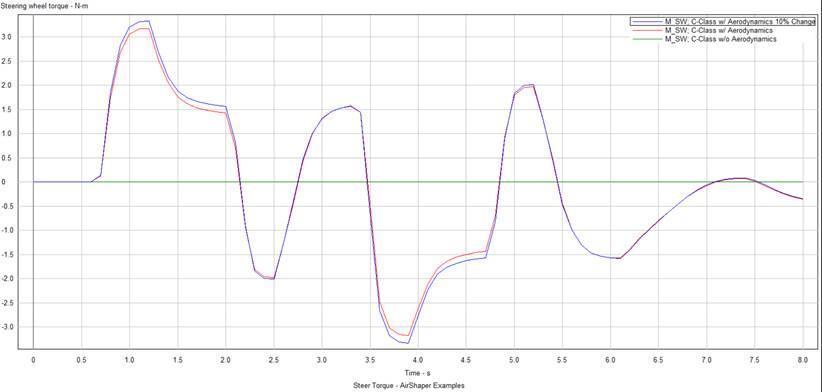
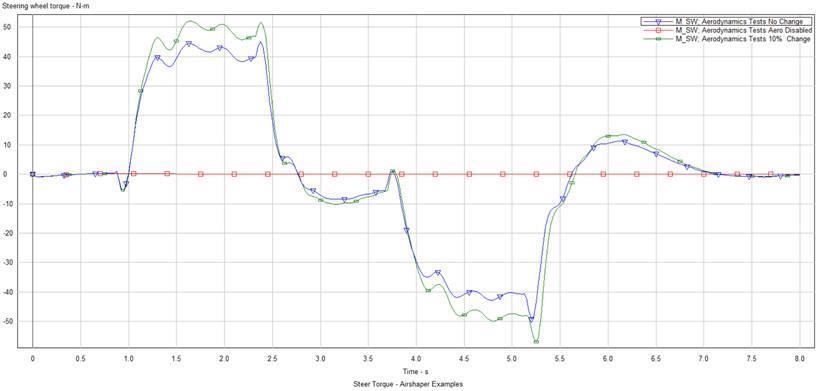
Steering torque
Case 1:
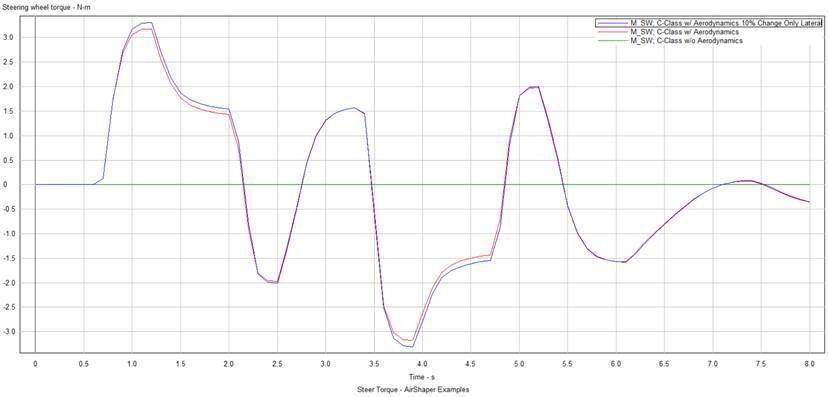
Case 2:
Observations
- Disabling the aerodynamic coefficients: as expected, this eliminates the wind forces on the vehicle entirely. Therefore, no changes in the steering wheel angle, yaw angle etc. are observed in the crosswind simulations.
- Increase the aero coefficients by 10%: this shows considerable changes in steering angle, yaw angle, lateral acceleration etc.
- Increase only the lateral aero coefficients by 10%: shows considerable changes in steering angle, yaw angle, lateral acceleration etc. but not much change is observed in the roll angle.
Test Scenario: Fuel Economy Testing
Set-up:
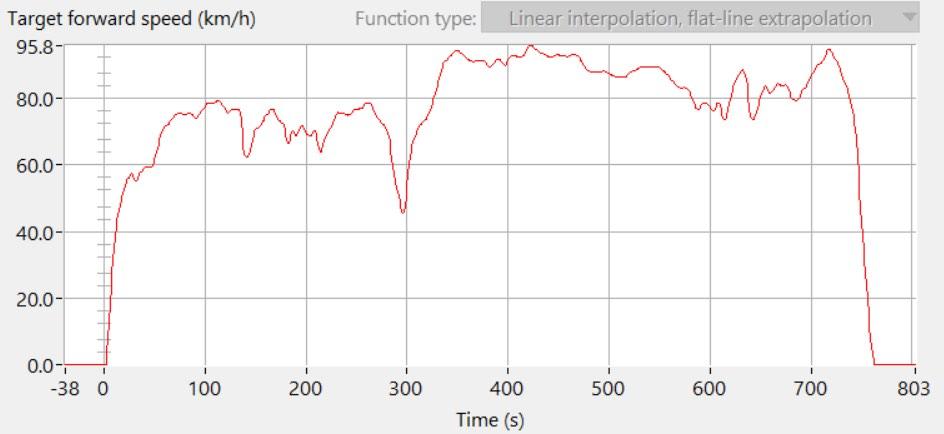
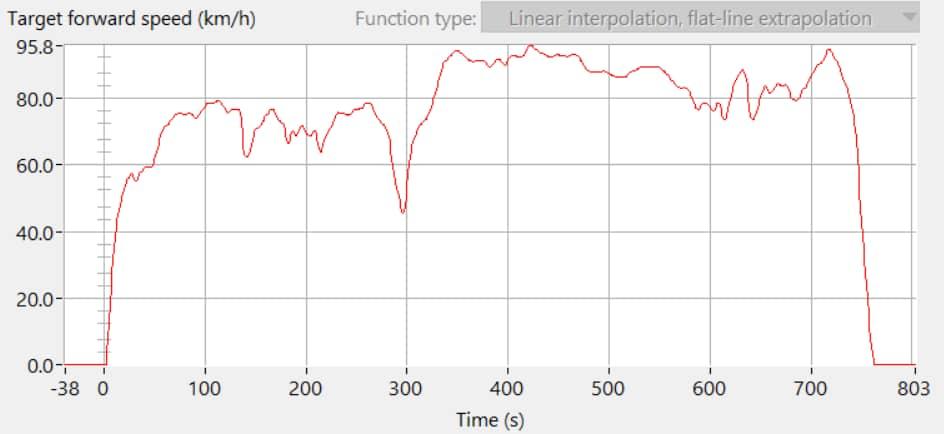
- Vehicle speed profile as per EPA Highway Fuel Economy Test Cycle (HWFET) on a straight flat road
- Fuel consumed over the cycle is measured
- The simulation was carried out for three cases:
- No Aerodynamics
- With Aerodynamics
- 10% increase in aerodynamics coefficient as shown in Figure 1 to 6
Results
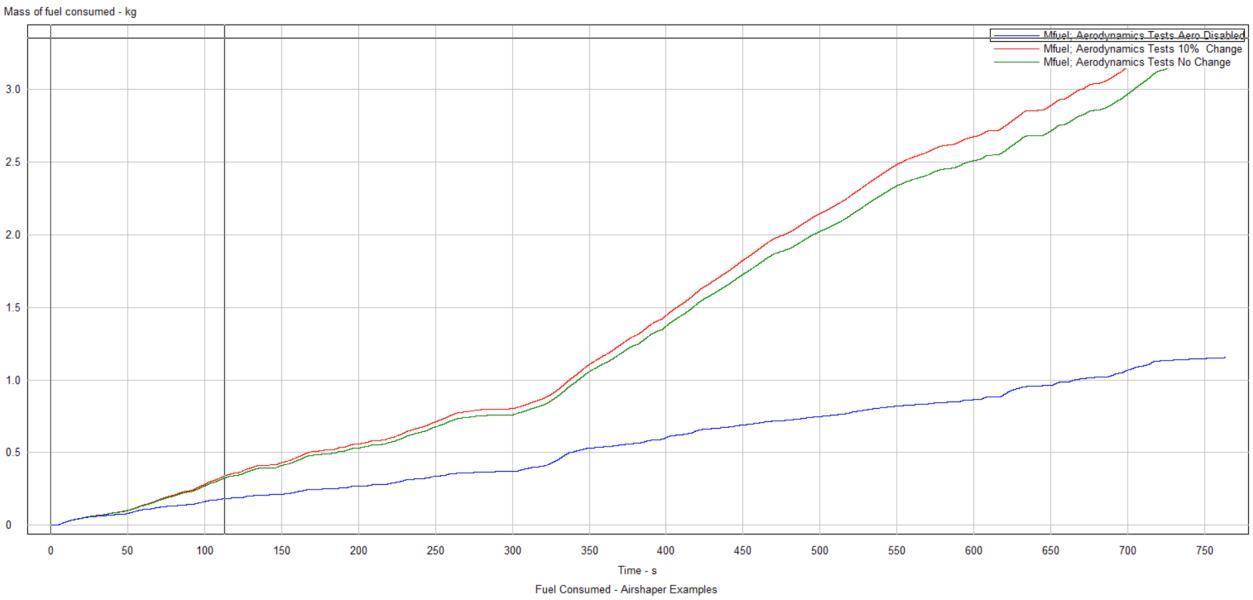
Fuel consumption
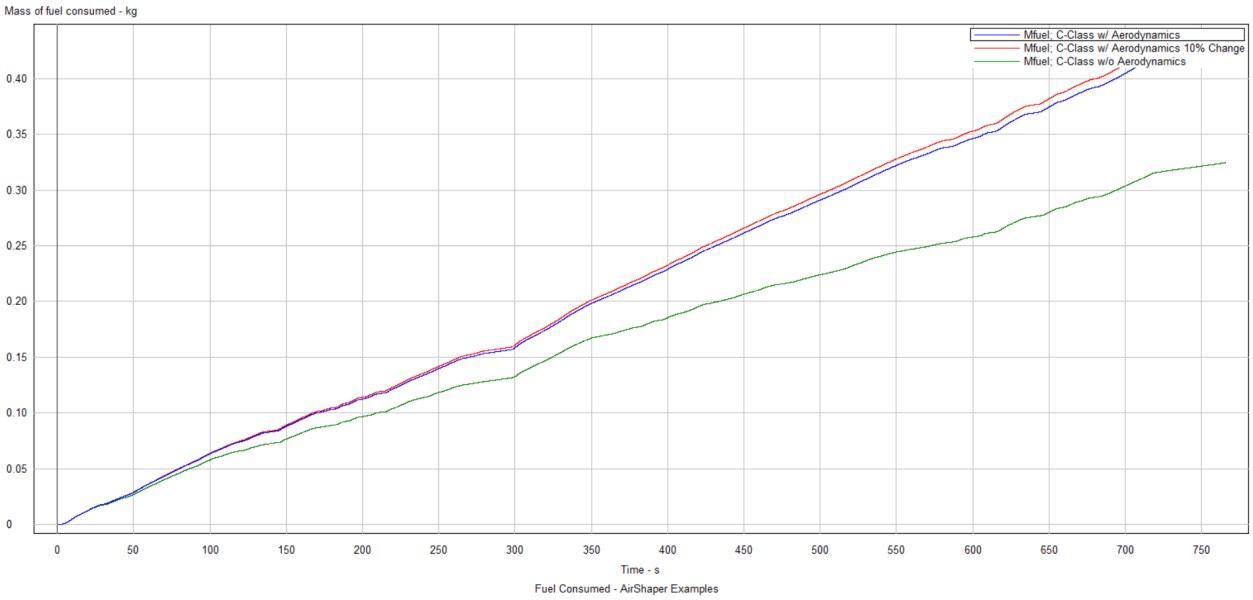
Observations:
- Disabling the aerodynamic coefficients: as expected, this eliminates any wind resistance and thus greatly reduces fuel consumption.
- Increase the aero coefficients by 10%: this shows a change in fuel consumption over the EPA cycle of around 3% - a considerable amount.
TruckSim Simulations
Test Scenario: Crosswind Testing
Crosswind Testing:
- Constant vehicle speed of 80 km/hr. on a straight flat road with μ=0.85
- Crosswind of 100 km/h from the left and right fans as shown in figure 12
- Parameters like steering wheel angle, yaw rate and lateral acceleration etc. are mapped @ the sprung mass (see section 5.2)
- The simulation was carried out for below Case:
- No Aerodynamics
- With Aerodynamics
- 10% increase in aerodynamics coefficient as shown below
Results:
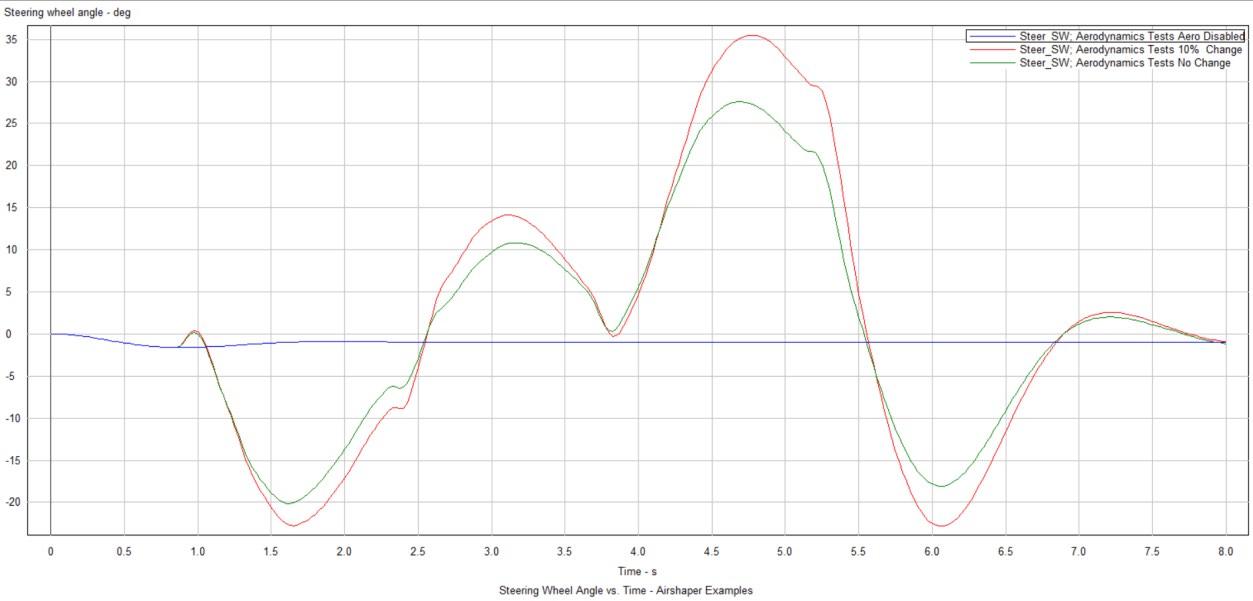
Steering wheel angle deviation
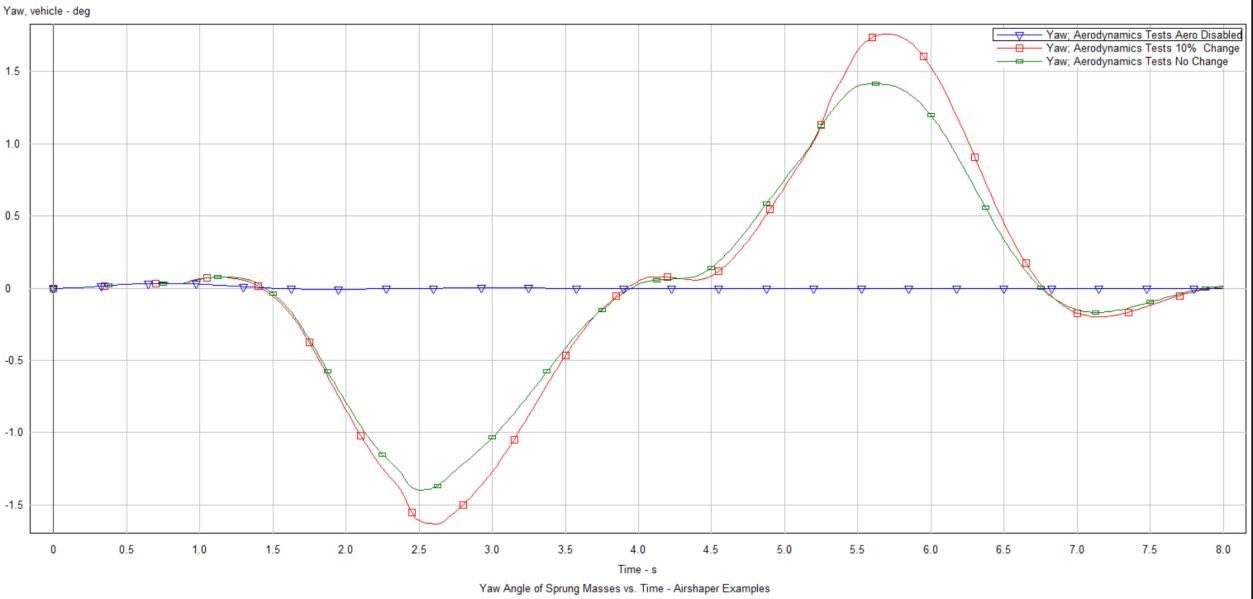
Yaw angle deviation
Roll angle variation
Lateral Acceleration
Steering torque
Observations:
- Disabling the aerodynamic coefficients: as expected, this eliminates the wind forces on the vehicle entirely. Therefore, no changes in the steering wheel angle, yaw angle etc. are observed in the crosswind simulations.
- Increasing the aero coefficients by 10%: this shows considerable changes in steering angle, yaw angle, lateral acceleration etc. These relative changes are often larger than the relative change of the coefficients themselves, so the effect is super-linear.
Fuel Economy Testing
Set-up:
- Vehicle speed profile as per EPA Highway Fuel Economy Test Cycle (HWFET) on a straight flat road
- Fuel consumed over the cycle is measured
- The simulation was carried out for three cases:
- No Aerodynamics
- With Aerodynamics
- 10% increase in aerodynamics coefficient as shown in the appendix
Results
Fuel consumption
Observations:
- Disabling the aerodynamic coefficients: as expected, this eliminates any wind resistance and thus greatly reduces fuel consumption.
- Increase the aero coefficients by 10%: this shows a change in fuel consumption over the EPA cycle of around 5% - a considerable amount.
Appendix
CarSim Set-up: Cross Wind Simulation
General
Aerodynamic parameters:
TruckSim Set up: Cross Wind Simulation
Download Original Paper

