From scanned CAD to an optimized car: aerodynamic shape optimization of an electric vehicle based on adjointOptimisationFoam
Abstract
This article presents the application of a complete aerodynamic shape optimization workflow, from CAD generation to gradient-based optimization, to an electric vehicle targeting the minimization of drag and, as a consequence, the reduction in electric energy consumption. The CAD files are generated by 3D scanning a real car model, the pre-processing and meshing is conducted using a user-friendly front-end of snappyHexMesh and the automated aerodynamic shape optimization is performed using adjointOptimisationFoam. The latter employs the continuous adjoint method to compute the gradient of the objective function; the software includes also the adjoint to the turbulence model equation.
1 Introduction
Two of the most critical characteristics of any electric road vehicle are autonomy and range. These are, among other, heavily influenced by the aerodynamic performance of the vehicle, especially in velocities higher than 80-90 km/h. Hence, the drag force exerted on an electric vehicle is of high importance and advanced computational tools, like automated shape optimization, can be used to reduce it.
To perform a CFD-based analysis and a subsequent optimization, the geometric description of the vehicle is usually needed in some CAD format. Even if an analytic CAD format is not available, a triangulated representation of the geometry under consideration can be obtained by 3D scanning an actual, real-sized car. A2MAC1 has a long experience in a variety of fields centered around automotive benchmarking, including full dismantling, analysis and part by part 3D scanning. Nearly 1000 vehicles are available in their database and nearly 100 new cars are processed every year, [1]. The STL files generated this way can then be used to build a computational grid around the geometry in question.
For instance, this can be performed with snappyHexMesh that can work with the potentially noisy and non-watertight STLs generated from 3D scanning and will automatically de-feature any geometric aspect of the scanned model that is smaller than the background mesh size. AirShaper has built a user-friendly, online platform that allows for the preprocessing, mesh generation and flow evaluation of any geometry, starting from an STL file, [2]. The platform provides both aerodynamic analyses (to analyse the performance of a 3D model) and aerodynamic shape optimizations (to optimize the performance of a 3D model - using adjointOptimisationFoam and following the ap- proach outlined in this abstract). Meshing, solving and post-processing are done in an automated way, making aerodynamic simulations and optimizations accessible to a broad user-base.
After the mesh generation has been conducted and the flow around the car geometry has been resolved, an automated shape optimization loop can be performed to optimize key performance indices of the car. In specific, the adjoint-based optimization workflow implemented in adjoin- tOptimisationFoam, [3], since OpenFOAM v1906 and enhanced since then can perform the shape optimization in a moderate number of optimization cycles and for a variety of objective functions.
In the context of this paper, the above mentioned methodologies and software are used in the aerodynamic shape optimization of the Volkswagen (VW) ID3 electric car. In specific, the ID3 geometry was 3D scanned in the facilities of A2MAC1 and the produced STL files were used to build a CFD mesh utilizing the AirShaper platform. Subsequently, an adjoint-based optimization was performed using adjointOptimisationFoam to reduce the drag exerted on the surface of the car, in an attempt to extend its autonomy and range.
2 Shape optimization of the VW ID3 car
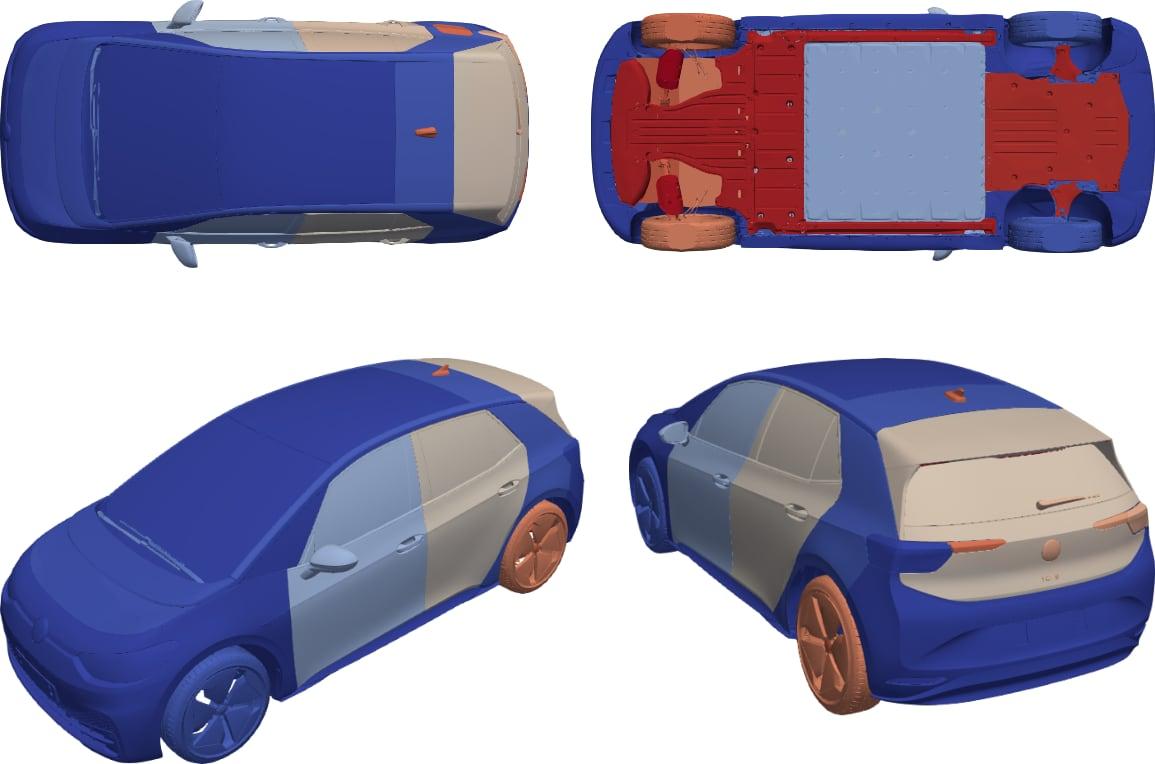
As a starting point for the aerodynamic shape optimization of the VW ID3 car, a full-scale model was 3D-scanned in the facilities of A2MAC1, producing a detailed STL file with ∼ 23 million triangles split into 142 geometric entities/patches, fig. 1.
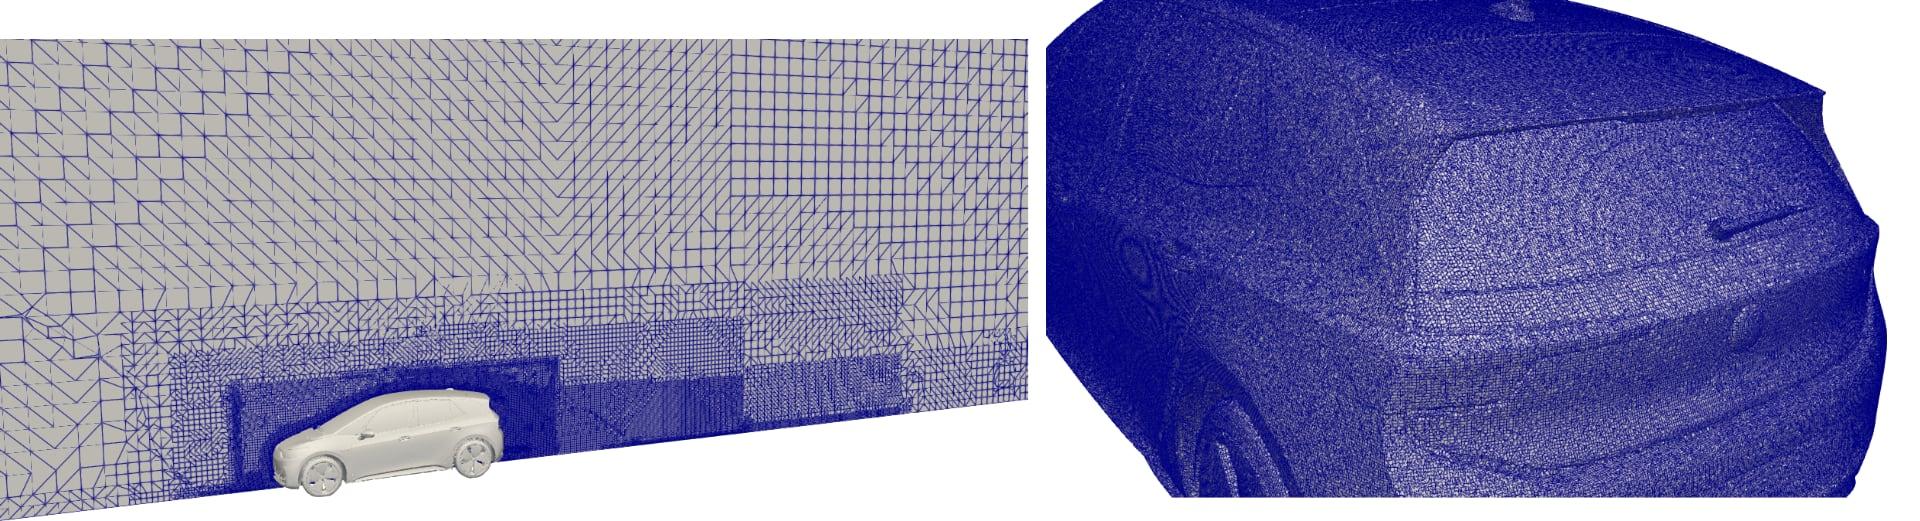
Using this geometry description, a CFD mesh was built around the entire car model using AirShaper’s front-end around snappyHexMesh, consisting of around 16.6 million cells and an appropriate refinement at the wake region, fig. 2.
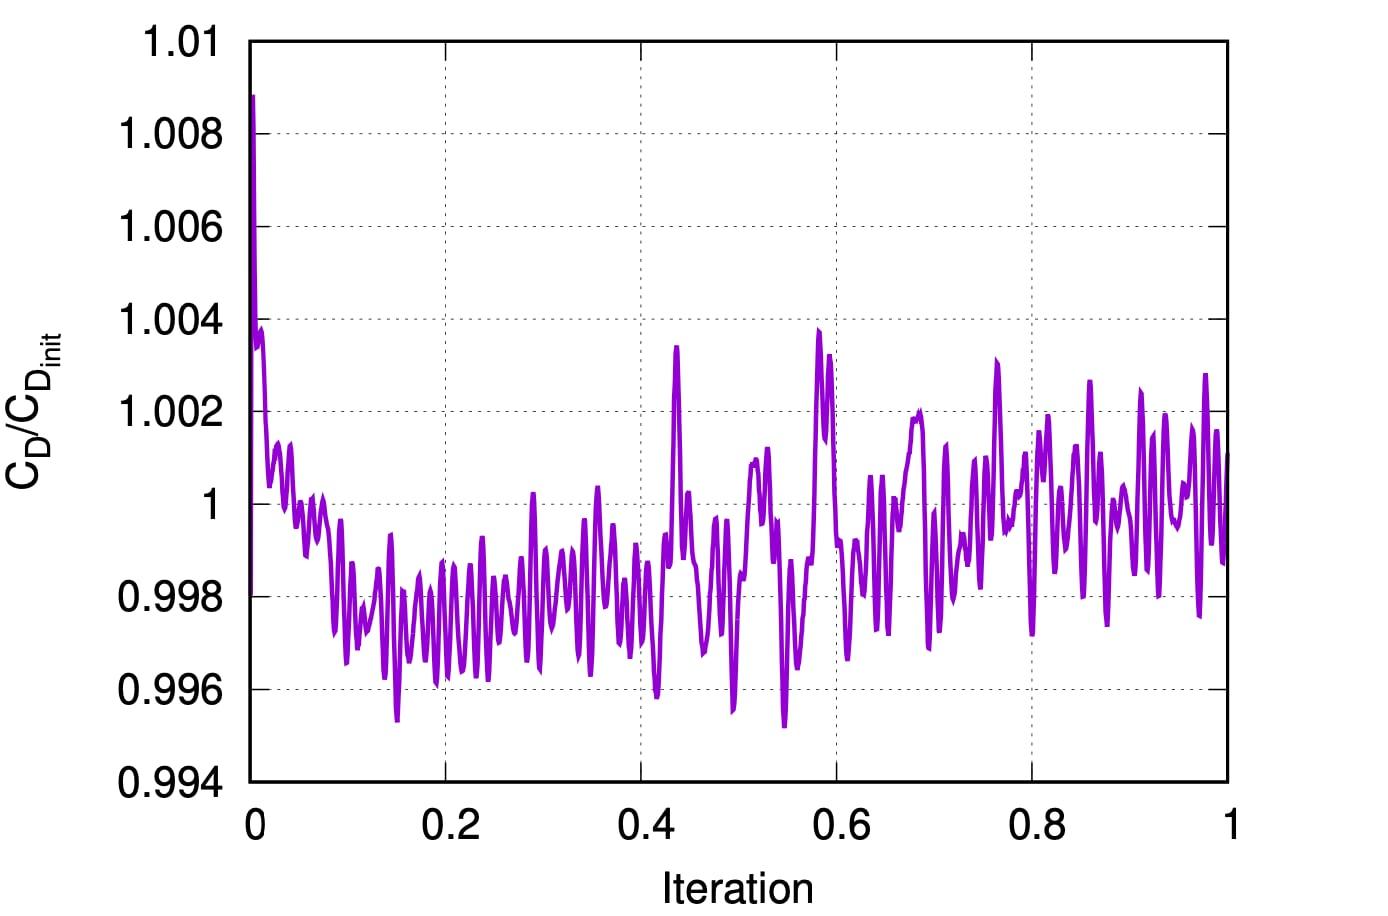
The subsequent solution of the flow equations included the steady-state RANS ones coupled with the Spalart-Allmaras turbulence model, [8], along with wall functions for computing the wall shear stress. The farfield flow velocity and the road velocity were longitudinal with a magnitude of 30m/s and the average y+ of the first cell centers off the wall was equal to ∼ 60. Since the flow equations can not converge to a steady-state solution due to the limit-cycle oscillation associated with the inherent unsteady nature of the flow, the steady–state flow solver was ran for 1500 iterations, with the drag force coefficient (CD) being averaged for the last 500 ones, fig. 3. A second-order upwind scheme was used for the convection term of the momentum equations and a first-order one for the corresponding term of the turbulence model PDE.
Subsequently, an adjoint-assisted, gradient-based optimization loop was executed using adjointOptimisationFoam, targeting the minimization of Cd. The mathematical formulation behind the continuous adjoint method employed by adjointOptimisationFoam can be found in [5, 4] whereas a recent review of its publicly available and in-house capabilities is reported in [6].
The optimization focused only on the spoiler area and was conducted by using the coordinates of the control points of a properly placed volumetric B-Splines morphing box, [7], as the design
variables of the optimization algorithm, fig. 4; the volumetric B-Splines box was also used to dis- place the internal grid nodes after each update of the car geometry, avoiding thus costly re-meshing in each optimization cycle. The adjoint-based optimization algorithm was then executed for 13 cycles, at an approximate cost of 26 equivalent flow solutions (13 flow and adjoint solutions around changed car shapes, under the assumption that the flow and adjoint solvers have approximately the same cost), reducing CD by more than 5%, fig. 4. The optimizer has led to a reduced drag coefficient by mainly reducing the height of the spoiler and turning its tip slightly upwards. Some indicative geometries generated throughout the optimization are depicted in fig. 5. Though the deformation of the geometry in the last optimization cycles may be rather large, it is indicative of the potential of the methods utilized. The showcased trend can be used to inspire designers, even if the outcome of the shape optimization loop cannot be practically adopted for reasons related to
disciplines other than aerodynamics (aesthetics, design philosophy of the car, safety, etc).
Fig. 6 depicts the difference in the local CD integrand between some of the geometries produced during the optimization and the baseline car. It can be seen that lowering the spoiler has acted in a beneficial way for the spoiler itself and the rear windshield whereas an increase in the local CD values can be seen in the area just upstream of the morphed spoiler. The effect of the spoiler area deformation on the separation of the flow close to the tail of the car can also be observed in fig. 7, from which it becomes clear that lowering the spoiler moves the separation area further upstream, with a beneficial effect for the local CD value on the spoiler itself and the rear windshield. Finally, the effect of the optimized spoiler on the wake of the car is visualized in figs. 8 and 9. The initial tipping of the center of the spoiler upwards increases the height of the wake in its center, figs. 8b and 9b, this effect is however mitigated in the next optimization cycles due to the lowering of the entire spoiler, figs. 8c, 8d, 9c and 9d. The width of the wake is slightly reduced as well. The beneficial effect of the lowered spoiler to the back pressure of the car can also be observed in figs. 9b to 9d.
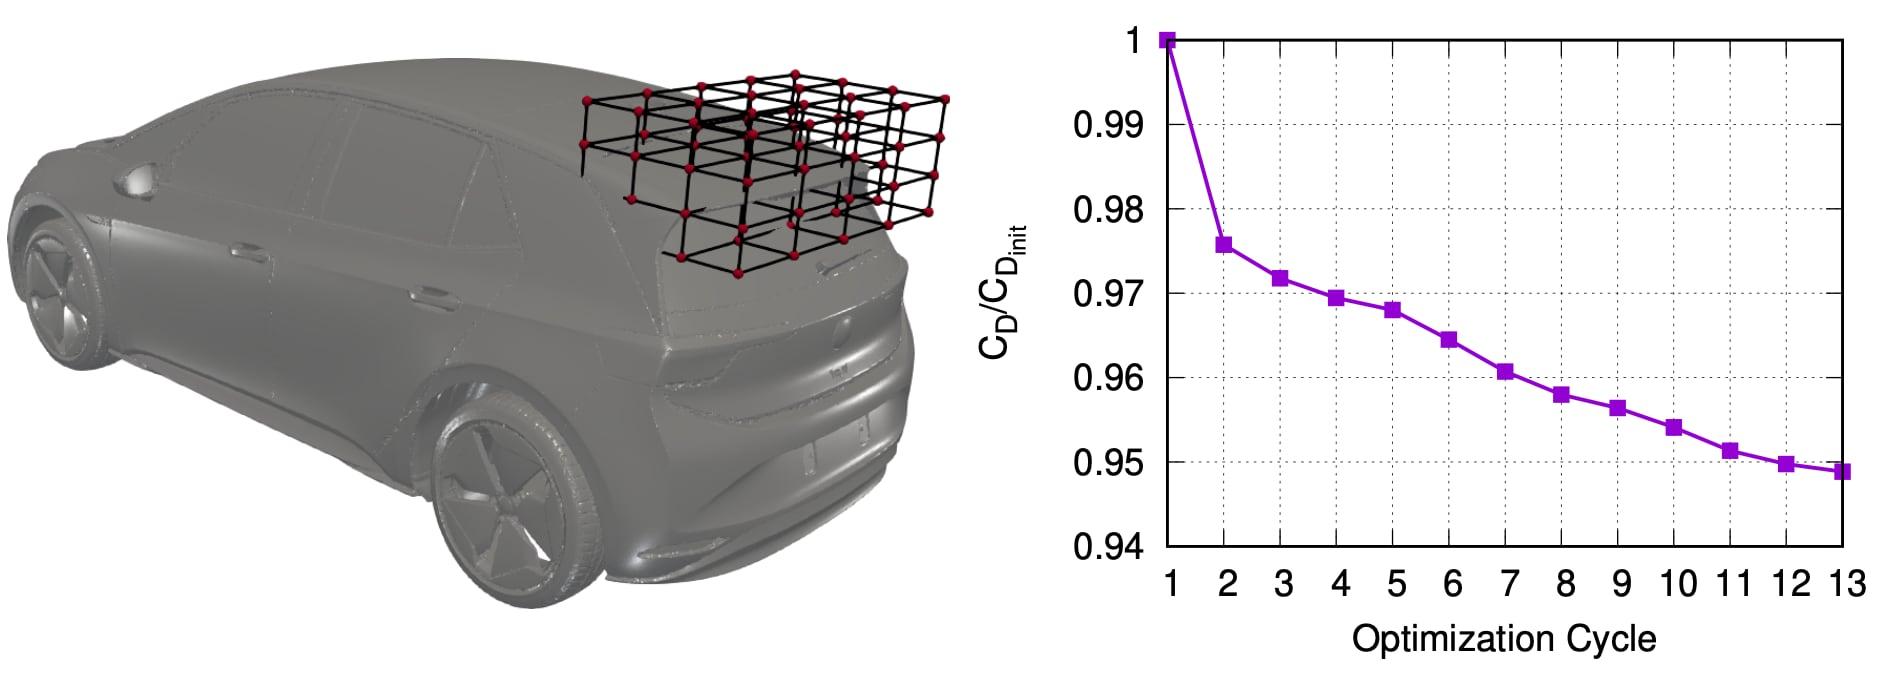
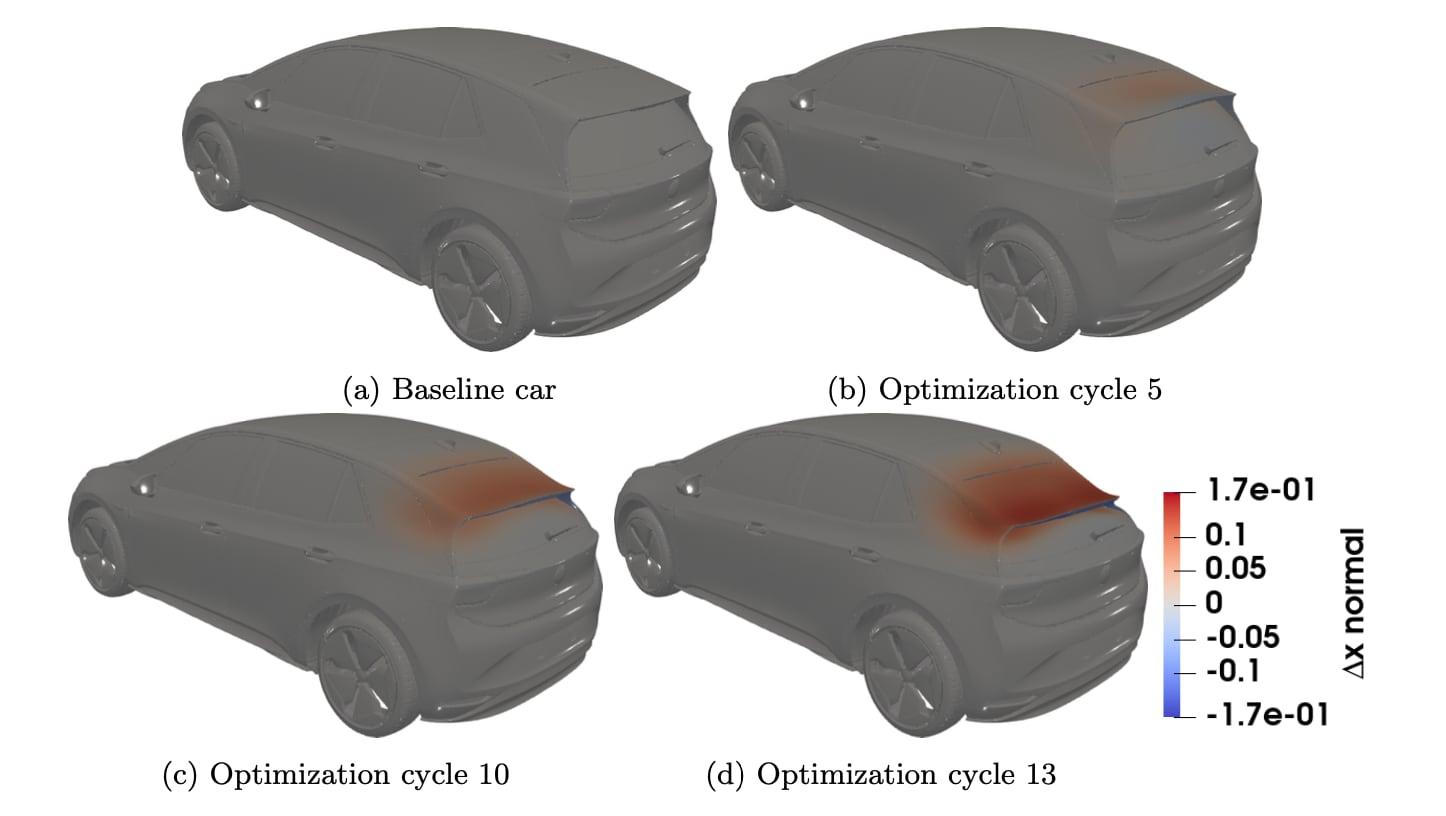
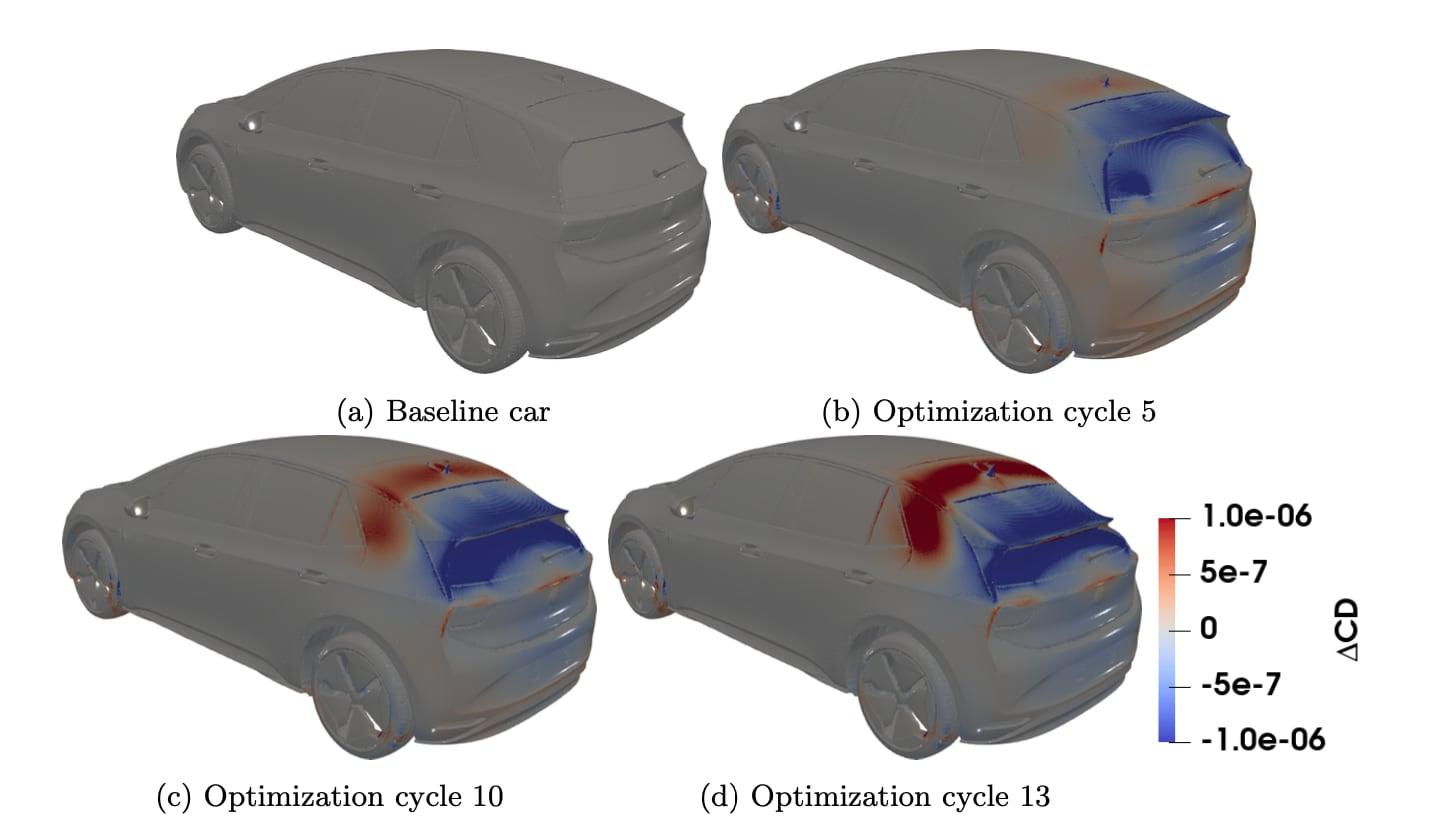
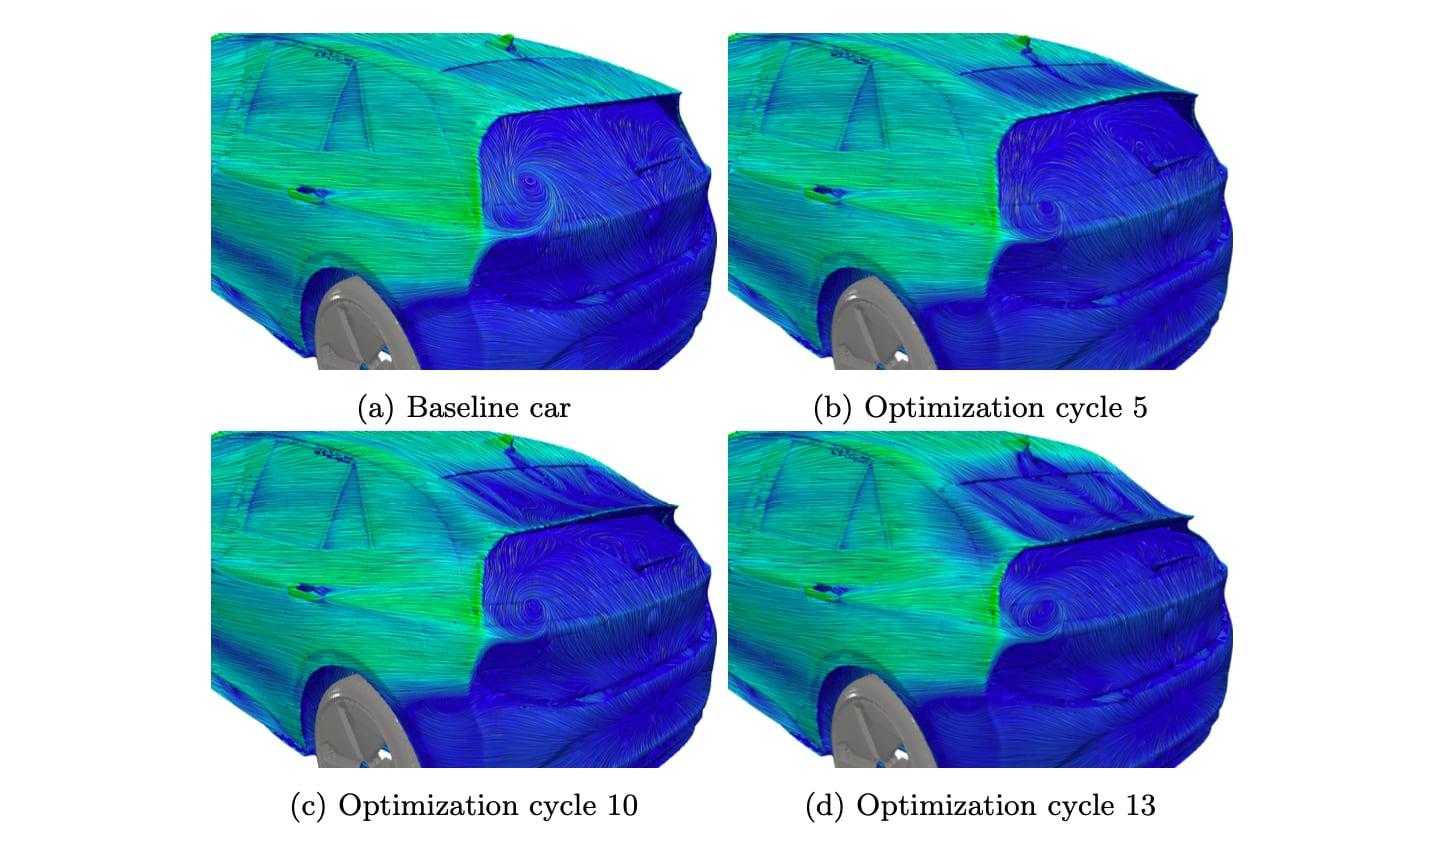
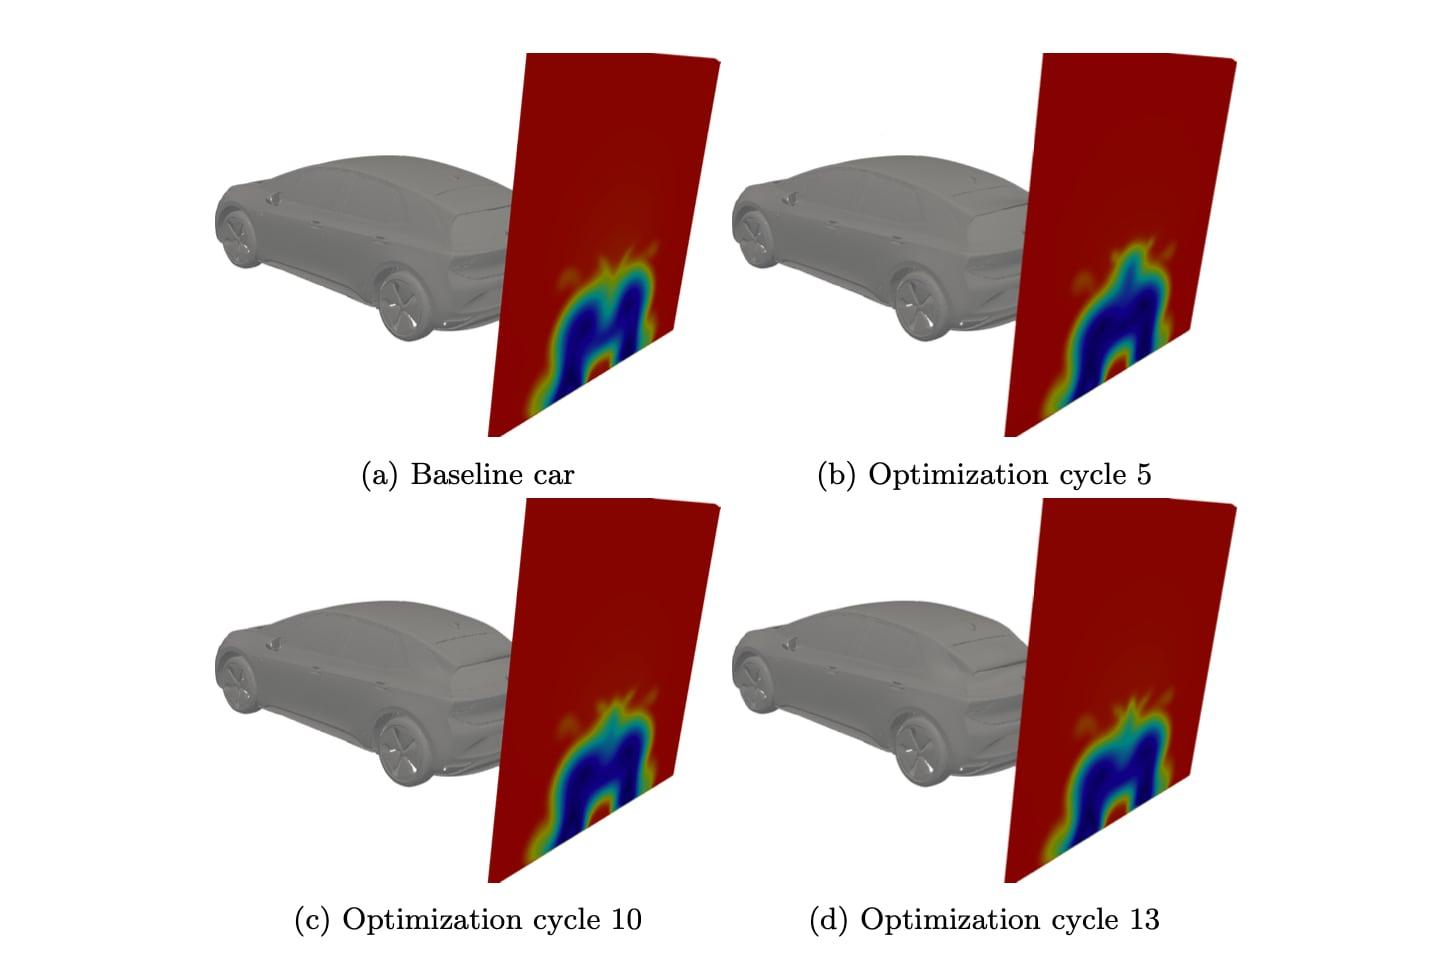
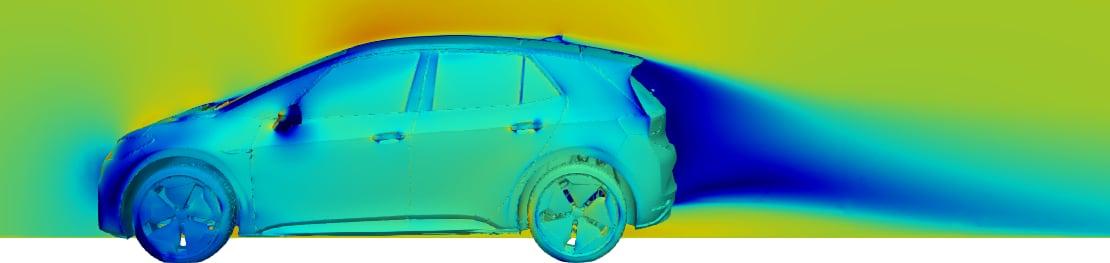
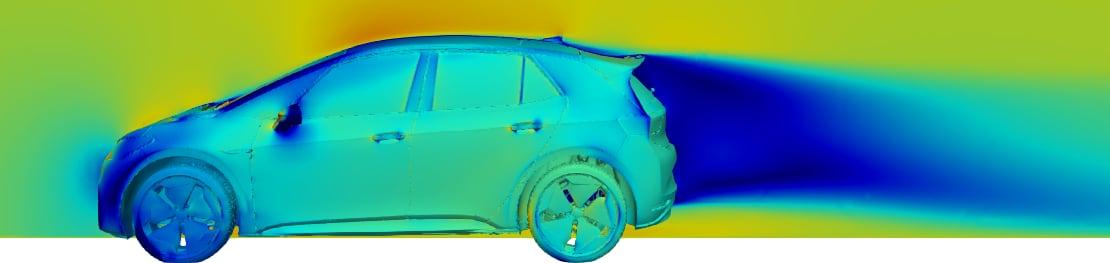

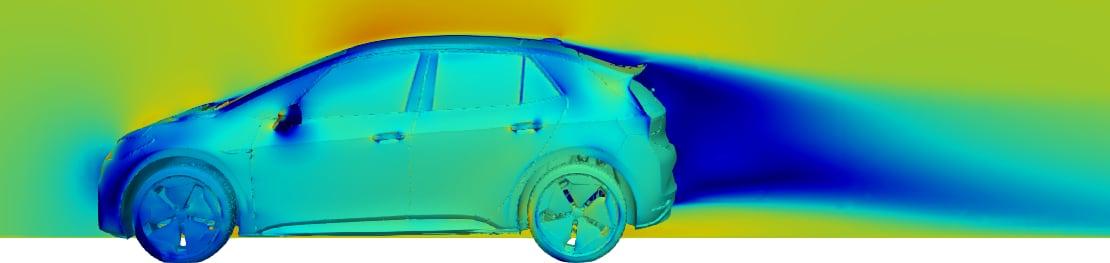
Figure 9: VW ID3, CD minimization: velocity magnitude plotted over a plane passing through the middle of the car and pressure plotted over the car surface, for some of the geometries obtained during the optimization.
3 Closure
This paper presented an application of a complete aerodynamic optimization workflow, starting from the 3D scanning of a real-sized car model, proceeding with the mesh generation based on the STL files of the scanned geometry and concluding with the flow solution and aerodynamic optimization of the Volkswagen ID3 electric vehicle, targeting a reduced drag force and, as a con- sequence, a lower electric power consumption. The 3D scanning was performed by taking advantage of the expertise of A2MAC1, the preprocessing, mesh generation and flow solver were setup effort- lessly using the fully automated AirShaper platform and the optimization was performed using adjointOptimisationFoam, recently integrated within AirShaper. The optimization led to a more than 5% reduction in the drag coefficient at a CPU cost approximately equal to 26 equivalent flow solutions, by lowering the spoiler area at the tail of the car and moving the start of the separation further upstream. Even though the final geometry is probably deformed to an extent that is larger than what can be accepted in practice, the fact that the whole process was performed on relatively noisy CAD files generated from 3D scanning and the extent of the geometry and grid displacement performed without the need of re-meshing attest to the robustness of the tools utilized.
References
[1] https://portal.a2mac1.com/.
[2] https://airshaper.com/.
[3] https://www.openfoam.com/news/main-news/openfoam-v1912/numerics.
[4] I.S Kavvadias, E.M. Papoutsis-Kiachagias, and K.C. Giannakoglou. On the proper treatment of grid sensitivities in continuous adjoint methods for shape optimization. Journal of Compu- tational Physics, 301:1–18, 2015.
[5] E.M. Papoutsis-Kiachagias and K.C. Giannakoglou. Continuous adjoint methods for turbu- lent flows, applied to shape and topology optimization: Industrial applications. Archives of Computational Methods in Engineering, 23(2):255–299, 2016.
[6] E.M. Papoutsis-Kiachagias, K.Th. Gkaragkounis, A.-S.I. Margetis, T. Skamagkis, V.G. Asouti, and K.C. Giannakoglou. adjointOptimisationFoam: an OpenFOAM-based framework for adjoint-assisted optimisation. In 14th ECCOMAS Thematic Conference on Evolutionary and Deterministic Methods for Design, Optimization and Control, Digital Event, June 28-30 2021.
[7] E.M. Papoutsis-Kiachagias, N. Magoulas, J. Mueller, C. Othmer, and K.C. Giannakoglou. Noise reduction in car aerodynamics using a surrogate objective function and the continuous adjoint method with wall functions. Computers & Fluids, 122:223–232, 2015.
[8] P. Spalart and S. Allmaras. A one-equation turbulence model for aerodynamic flows. In AIAA Paper 1992-0439, 30th Aerospace Sciences Meeting and Exhibit, Reno, Nevada, 6-9 January 1992.
Download Original Paper

