🙋 About the Author
For many years, Benjamin worked in research and development of turbomachinery applications for ABB. Optimization using CFD (computational fluid dynamics), heat transfer and fluid-structure interaction were important topics at that time. Since 2014 he is partner at Swiss company streamwise GmbH and is one of the core developers of their ProCap system, a tool for 3D real-time velocity measurements (around objects in a wind tunnel for example).
Acknowledgements
Racecar geometry images and CFD-Results courtesy of Academic Motorsports Club Zurich (AMZ) from ETH Zurich, Frank Schaufelberger.
The Aerodynamic Design Cycle
An aerodynamic design cycle is typically structured as follows:
- Concept: the creation of design ideas based on certain fluid hypotheses that can theoretically provide improvements. These concepts are then translated into digital 3D models and/or physical prototypes.
- Verification: this is where the flow around the new design is analysed to verify the hypothesis of a design. This can be done through CFD simulations and/or wind tunnel testing and/or real-world testing.
- Optimization: based on the results, the design is modified.
This cycle is then repeated until the defined goals have been reached. Here's an example: The drag of a wing can be reduced by lowering the curvature (design idea) such that the separation zone is decreased (hypothesis). In a situation where a modification (curvature change) does not provide the desired result (drag reduction) as expected, the engineer must verify the flow topology and search for reasons, then improve the hypothesis and the design.
Over time, the majority of verifications are done through CFD: codes have become more accurate, computers have become more powerful. But sometimes CFD is not able to capture certain real-world effects, or it would be prohibitively expensive/time-consuming through CFD. In such cases, wind tunnel tests are the preferred verification method. But in a wind tunnel, it is much more difficult to visualize the flow and thus more difficult to verify & improve the hypothesis. This is what we call the verification gap: you have the real flow in front of you, but you cannot see it.
Closing the Gap
In such a situation it is not uncommon to fall back on the good old smoke probe or tufts as a measurement tool. Although very easy to set up, these methods provide only limited and purely qualitative information to the operator (they show the direction of the flow, but not the magnitude). And because the smoke itself is an aerodynamic phenomenon, it is difficult to compare this to CFD results.
High-tech PIV (Particle Image Velocimetry) systems are also on the rise - they use lasers to scan the flow speed & orientation in 2D planes. Fantastic technology, but they have the disadvantage of being very expensive and dangerous for humans.
The idea behind the ProCap (Probe Capture) flow measurement system is to close this gap: Keep the intuitive handling of a smoke probe but at the same time provide accurate, quantitative measurement data visualized in real time.
The region of interest is manually scanned by the operator using a hand-held probe while the system optically tracks the probe’s instantaneous position, records the probe data, and visualizes the flow field in real-time. This allows to map out the effect of a design modification quickly and the assessment of the 3D flow data can start at the time of the measurement. The quantitative dataset can be lined up against wind tunnel data or compared in detail with CFD data.
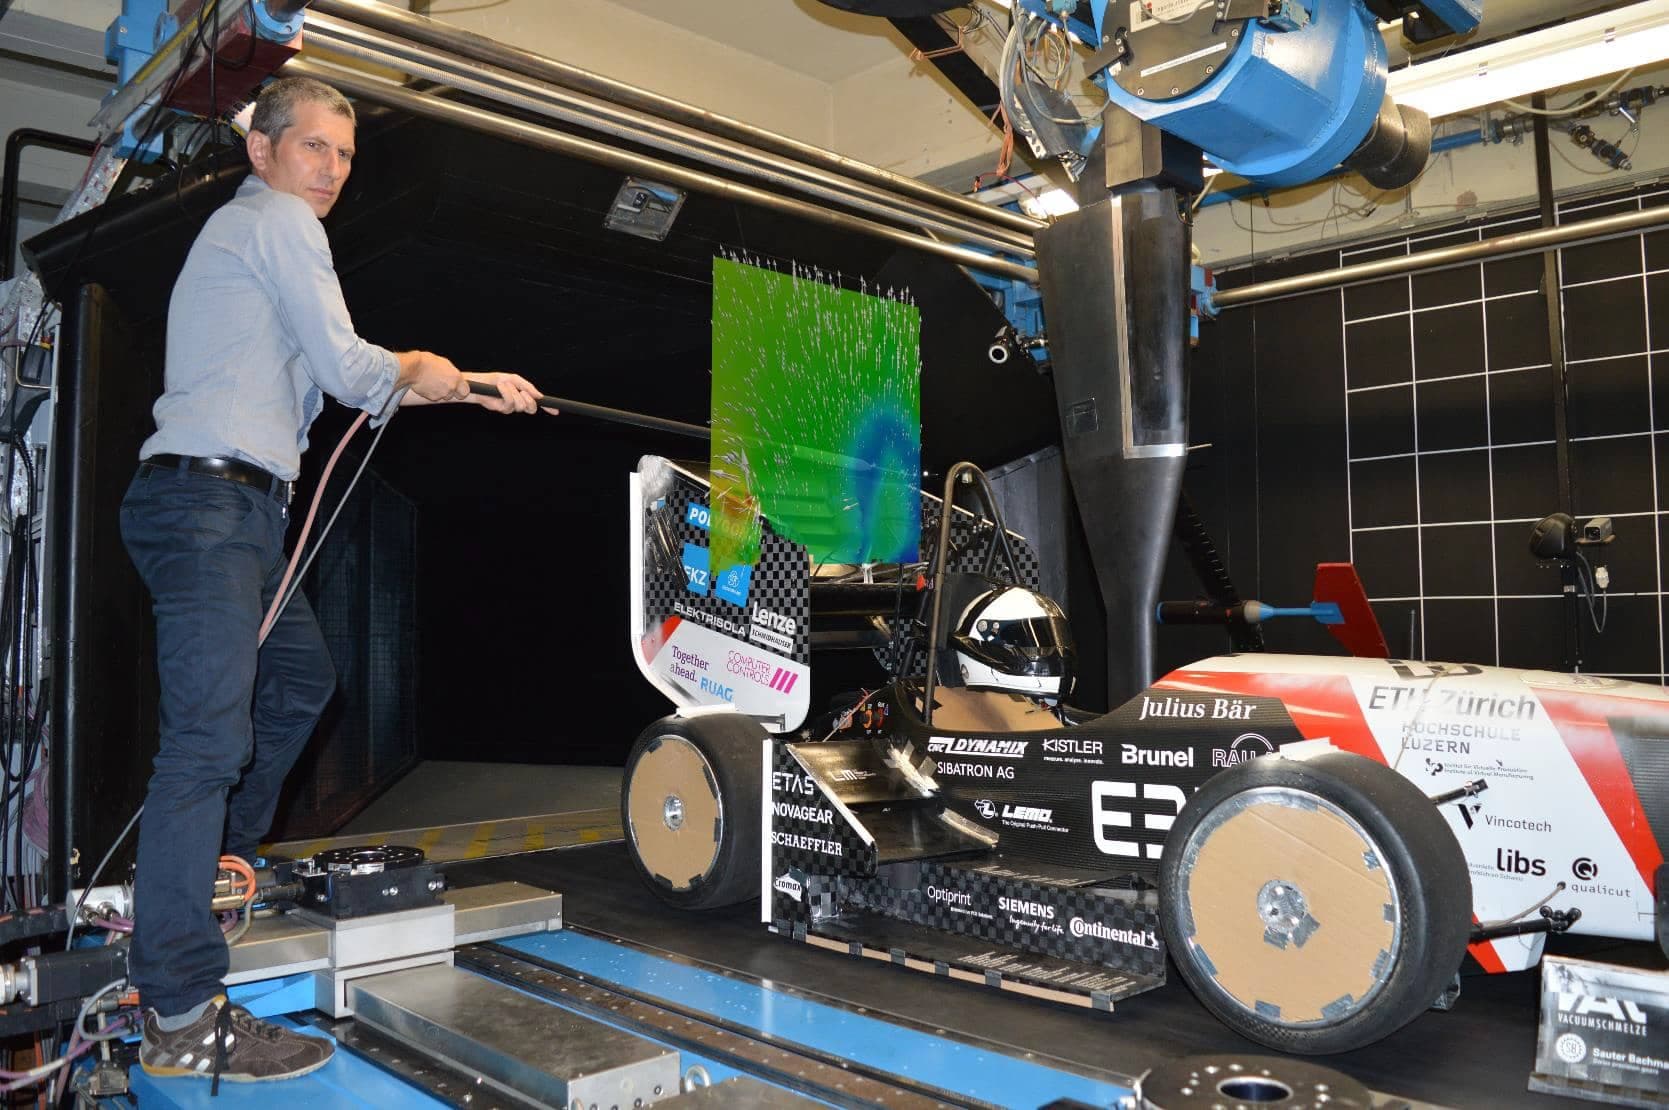
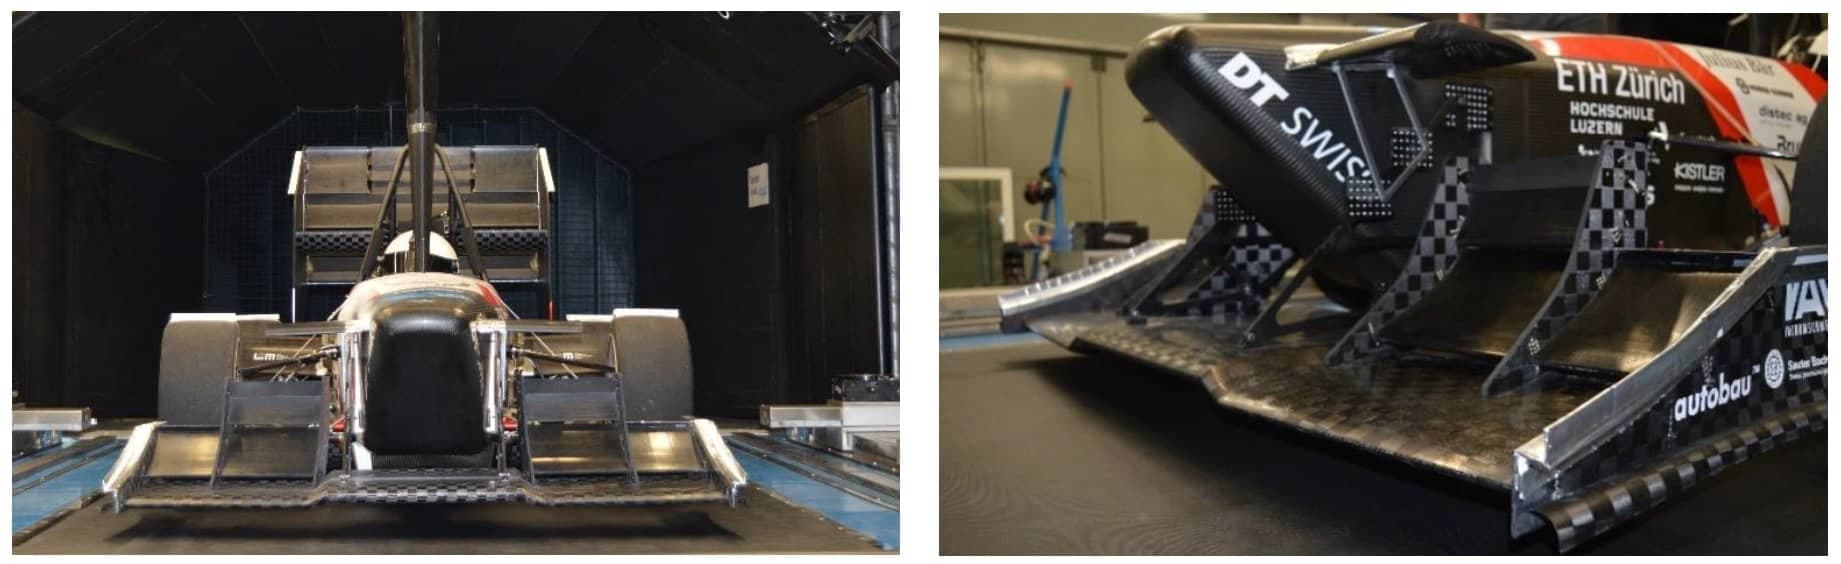
Case: Formula Student Electric - ETH Zurich
One of the cases where real-world effects play an important role are race cars: The exact shape of edges and corners, the vibration of the structure, the surface roughness of a leading edge, the deformation of a wing due to aerodynamic loads: all these details are difficult to get right in CFD but can have a substantial influence on the flow and the overall performance. At the same time, due to the complex geometry and flow topology, flow measurements are difficult.
AMZ Racing from ETH Zurich, a former winner of the competition, optimized their eiger car in the wind tunnel using the ProCap system. Although we cannot show too many details and unveil secrets here, we can provide qualitative insight into the measurement data and how it helped to close the verification gap. The measurements took about 5 hours in total for all runs (including setup changes). The team also performed CFD simulations (CFD data shown are from DES (detached eddy simulations) averaged over 1.2 seconds physical time) prior to the wind tunnel tests, so a comparison between the two data sets was possible.
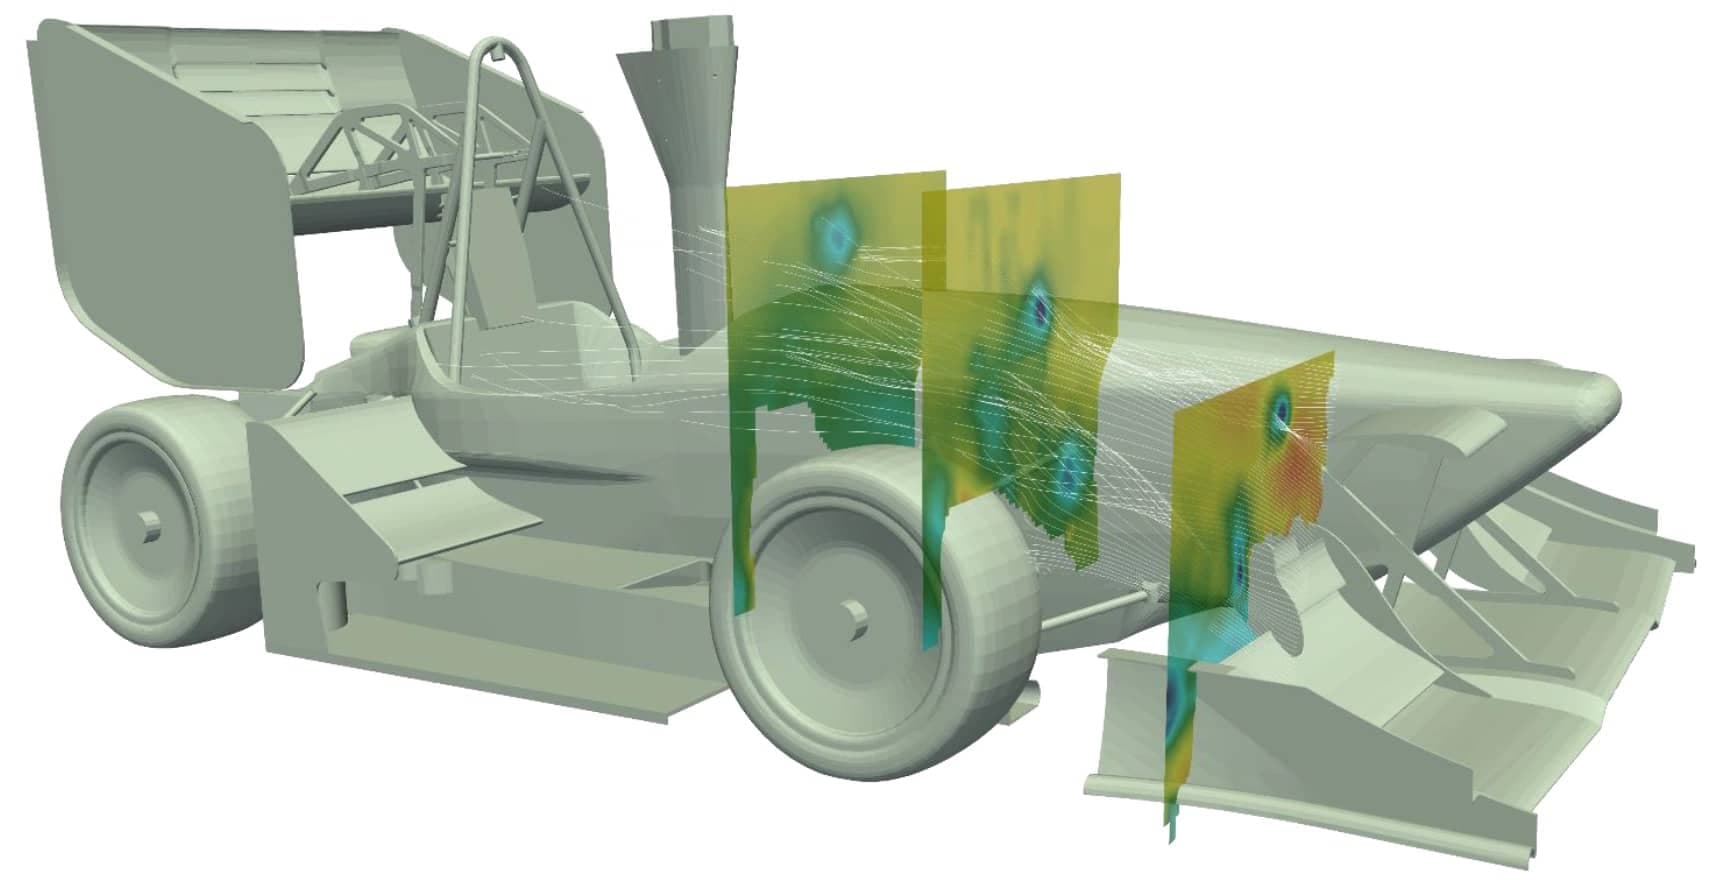
The image above shows the location of 3 exemplary visualization planes from the entire measured 3D data set. It is interesting to see the location of the tip vortex from the upper nose wing, which is important since this vortex is designed to bring high energy flow to the rear wing of the car to generate as much downforce as possible.
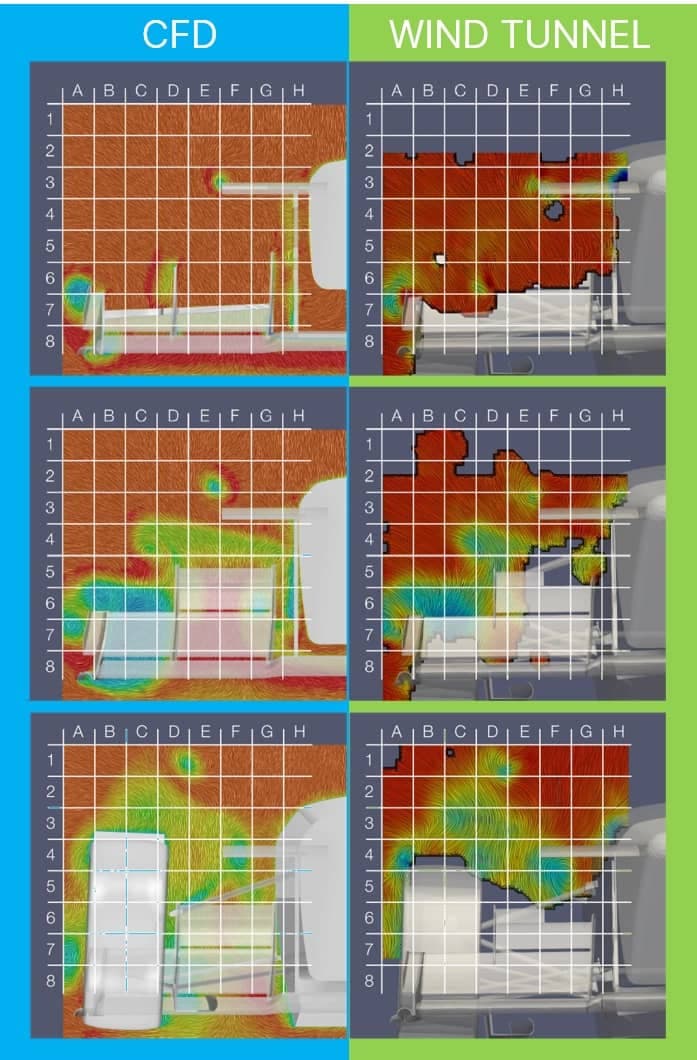
In the images below, the total pressure coefficient (colour map) and streamlines (pattern) are shown for 3 planes around the front wing for both CFD and measurement data. While the overall flow topology matches very well between measurement and CFD data, some discrepancies can be found e.g. in the positions of the vortex cores or the sizes of the low-pressure zones, etc. Using 3D measurement data it was possible to locate these discrepancies between CFD and reality.
Conclusion
Measuring velocity vectors & magnitudes in 3D by freely moving a probe makes it easier to understand the complex flow structure around a race car. Overall results match very well with CFD findings, and local discrepancies provide an indication as to where real-world effects might play an important role.
Interesting links:
streamwise Procap
Run Your Own Simulation
How to Interpret CFD Results