Introduction
Aerodynamics is a very complex field. Air is invisible and to see what is going on, you need to somehow add something to the flow (like smoke) or the surface of the model (tufts) or measure a derived quantity (like pressure) at different points to re-construct what is happening in terms of velocity from your experience with similar cases.
While this has worked well in the past and fantastic things have been achieved by talented engineers with years of experience, today’s race for performance, efficiency and energy saving can only be won if detailed and precise 3D datasets are available. To obtain this, there are basically two, sometimes competing approaches available: CFD (computational fluid dynamics) and wind tunnel flow measurements. Each in his own way, both approaches are similarly complex.
CFD requires to solve the complex Navier-Stokes equations that describe the flow around an object. Which in theory is fairly straight-forward but solving them for larger setups quickly becomes extremely challenging. The discretization (meshing) of the model geometry (often including ventilation openings, rotating wheels and small details like bolts and wires), the large number of computational cells typically used (50 Mio cells and more) and the effect of model surface structure that determines the point of turbulent transition and flow detachment need to be tackled, to name just a few. This results in simulations that must be run overnight on high-performance clusters, produce datasets in the order of several tens Gb per configuration and require experienced engineers to setup, run and analyze.
The picture is the same if you turn to highly advanced optical flow measurement techniques like PIV (particle image velocimetry) or traversing systems capable of mapping the flow around the model in a wind tunnel. It helps that wind tunnel tests are anyways required for validation or WLTP emissions calculations. And you can be reasonably confident that the measurement data represents reality fairly well, at least for the setup in the wind tunnel. However, an expensive setup including powerful lasers and cameras, or traversing equipment is needed. Plus, again, a set of well-trained engineers that can handle the calibration of the optics or the programming of the traversing system. Not to mention the finer points like laser safety, seeding, several hours of measurement time and days taken up by post-processing.
Bottom line for both approaches is: The achievable quality and accuracy of the data is impressive. But for an initial assessment of a design during the concept phase, a quick comparison of configurations and most optimization tasks they are both simply too expensive and time consuming. To accelerate aerodynamic development, we must provide a simplified, yet effective toolset.
Speeding up insight
In terms of simulation, such options include cloud platforms like AirShaper that automates the process of CFD simulations. Instead of spending days on pre-processing, solving & post-processing, the process is streamlined to provide results often within hours. The compromise is that many of the small, expert software settings are hidden, in return for a more generalized / standardized approach & simulation output.
How to Runa Simulation on AirShaper
Along the same idea but for experimental wind tunnel work streamwise gmbh developed ProCap, a scan-and-paint approach that allows to analyze the flow in real-time while at the same time providing a fully 3D volumetric dataset. Rather than providing ultra-precise results in terms of spacial resolution and accuracy, this approach offers a much more flexible, time efficient way to obtain quantitative data in the form of a fully 3D flow field, perfect also to validate CFD results.

ProCap in Wind Tunnels
Case study
We want to introduce the two new concepts in some detail here but also clearly and openly illustrate the benefits and drawbacks of both techniques. To this end, both AirShaper simulations and ProCap measurements were applied to the Drivaer model, a reference car geometry widely used in the automotive industry. As both techniques provide full 3D data, the comparison of the results is straight forward using a CFD post-processor. The setup was a 1:4 scale model with fixed wheels at 25 m/s.
simulation
In terms of simulation, one of the main choices to make is how to approach the boundary layer. This is the layer of air sticking to the surface and it features high velocity gradients normal to the wall. One way to take this into account is to use prism layers, which are very "flat" cells used to increase the resolution normal to the wall, to capture the velocity gradients and flow separation locations. But this is expensive in terms of mesh count and it is also more challenging to automate, especially on complex geometries. Therefore, wall functions are often used: these are "precalculated" velocity profiles that are then applied to the relatively large cells close to the boundary layer. It makes the whole process of meshing and solving a lot more robust, but can create slight differences in terms of boundary layer behaviour. The benefits of AirShaper, though, include the possibility to work with non-watertight models (no need to spend weeks closing small gaps & holes) and have results within hours of uploading the 3D model.
measurement
The accuracy of a measurement is typically limited by how accurately you can re-create reality in the wind tunnel. Error sources includes the presence of walls, boundary layers on the floor, mounting points of the model, etc. When using a probe, the finite size of the probe will also affect the flow and especially close to a surface (below one probe tip diameter or 4 mm for ProCap), errors become significant. When working with ProCap, an additional source of error (quite similar to mesh resolution in CFD) must be taken into account. As the spatial resolution is a direct consequence of the number of measurement points per volume, a too short measurement time can result in poor resolution of velocity gradients. Typical measurement times for the volumetric data shown in this comparison are 30 minutes total, with only 30 minutes to factor in for setting up at the beginning. To do a comparison of different configurations one would focus on a single plane and thus be able to cut measurement further. Compared to using a traversing system, ProCap typically achieves a speed-up of 50 to 100.
results
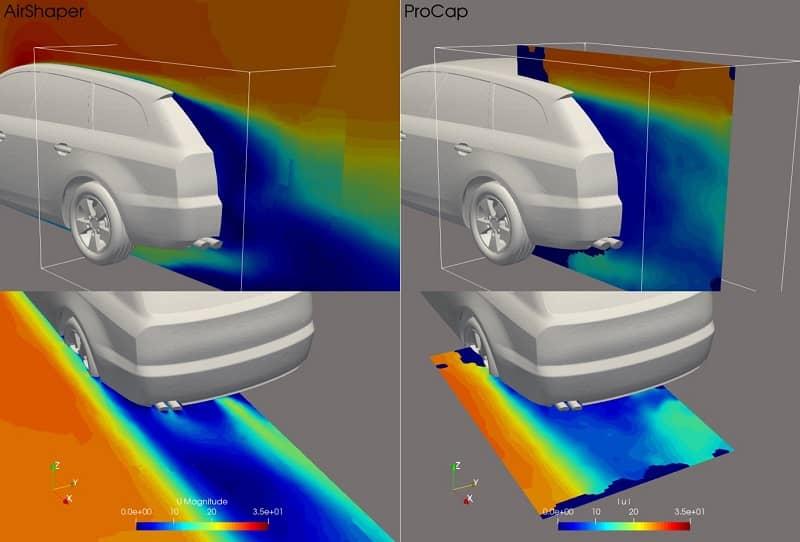
Overall flow pattern (figure 1): the overall flow & pressure patterns provided by AirShaper and ProCAP measurements are very similar. They both provide an excellent overview and understanding of the flow topology and lead to the same conclusions in terms of wake size & structure, high & low pressure zones around the car etc. at a fraction of time and money. In some areas differences are visible as they would be in any comparison of numerical and experimental data, some of which are pointed out here (Figure 2).
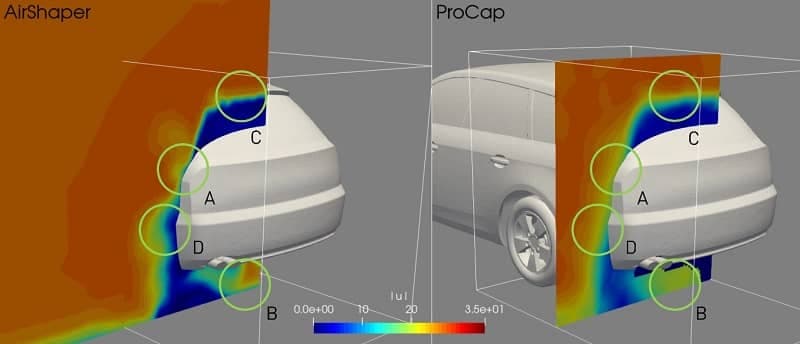
Boundary layer (Figure 2, A): In the simulation data, the thickness of the boundary layer is determined by the cell size in this area. For ProCap, the resolution close to the surface is limited by the physical dimensions of the probe (4 mm) which explains that the velocity does not reach zero at the wall.
Underfloor aerodynamics (Figure 2, B): the velocity of the air underneath the car is higher in the AirShaper simulations compared to the ProCAP results. One explanation for this is the impact of scaled model testing: the ProCAP results are based on physical wind tunnel results, where surface roughness on both car & ground can influence results. Also, depending on the upstream length of the wind tunnel test section, the boundary build-up can be quite significant (reducing the air speed below the car), as the floor is static. The AirShaper simulation also has a static floor (although a moving floor is also possible), but of limited length. Another argument is that the wall functions under-predict the boundary layer thickness, especially because a perfectly smooth surface is assumed. And in terms of ProCAP measurements, the relatively coarse spatial resolution of the capturing in that area (due to the confined space and difficulties in the optical tracking with cameras placed above the model) leads to interpolation effects, reducing local gradients and peak velocities.
Shear layers (Figure 2, C): the "thickness" of the transition layer between the wake behind the car (slower moving air being dragged along) and the free stream air (air flowing on top of the wake) is smaller in simulation compared to the ProCAP measurements. One reason for this is that the AIrShaper simulation uses a turbulence model to resolve velocity variations, and perhaps the applied model underpredicts the thickness of this shear layer. In terms of ProCAP measurements, the finite dimension of the probe and resolution of the grid creates smoothing effect, which can overpredict the shear layer thickness.
Wake regions (Figure 2, D): Differences of the wake behind the wheel illustrate the sensitivity to surface roughness and small details, both difficult to reproduce correctly in CFD geometry and the wind tunnel model.
Which tool to use?
Both the AirShaper and ProCap offer an alternative to the high-end high-cost approach in aerodynamic development able to provide 80% of the information for 20% of the budget. Can they provide valuable data and help to understand and improve the design? Absolutely. Is there a tradeoff between speed and accuracy? To some extent, yes. But the goal is not to replace the high-end stuff but rather to offer an option where otherwise no data at all would be available.
Challenging in this comparison, but also in most real-life cases, is the lack of ground truth. As so often, there remains a grey zone in terms of which method accounts for what difference. Of course, when validating & developing such tools, it's important to benchmark results versus "well known & documented" cases (like this Tesla Model Y). This helps to build a "general understanding" of the limitations of each tool. But for specific, non-standardized cases, an amount of uncertainty around result accuracy will always remain.
While AirShaper strongly accelerates the digital phase, with a fully automated CFD workflow able to analyze & compare the full flow pattern of various design concepts in just hours, ProCap provides substantial advantages during physical wind tunnel testing, correctly capturing fine details & flow separation on the fly in the wind tunnel.
Which tool? Both please :)
Interesting links:
Streamwise
Run Your Own Simulation