Did you know that only one fifth of the world’s ocean floor has been successfully mapped? Although this is a substantial improvement from 2017, where 6% was mapped, there is still an abundance of unchartered waters to explore [1]. Fortunately, the recent surge of development around Autonomous Underwater Vehicles (UAVs) has transformed these vessels into advanced research tools that are helping oceanographers understand the depths of our oceans and how to protect these oceanic habitats from climate change.
What is an AUV?
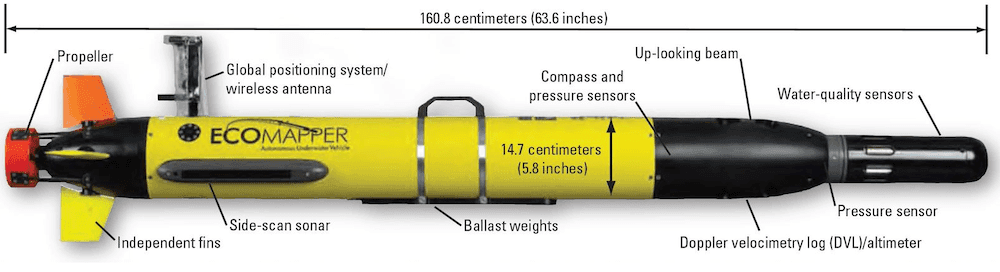
A AUV is a torpedo shaped vessel that can manoeuvre itself close to the sea floor. Some of the latest designs are 1.5-5.5m (5-18ft) long and weigh between 20-1,400kg (45-3,000Ibs) [2]. They utilise sonar technology such as multibeam and side scanning systems that can map the seabed in 3D at much higher resolutions than could previously be achieved with other submarines. AUVs are also instrumented with fluorometers, turbulence sensors, magnetometers and water-quality sensors and all the data collected is stored onboard until the AUV reaches the surface.
AUVs travel through water via propellors or fixed hydrofoils, depending on the design. Propellor AUVs are typically used for seabed surveys whereas hydrofoil AUVs are more suited for offshore studies. The former uses spinning angled blades to create an area of low pressure above the blades and an area of high pressure below the blades. This pressure difference generates forward thrust.
A hydrofoil AUV uses variable buoyancy propulsion instead. This is where a pump moves internal weights back and forth to alter the vessel’s buoyancy. Its hydrofoils generate lift and glide forward as it rises due to its buoyancy and falls due to gravity.
The importance of hydrodynamic efficiency
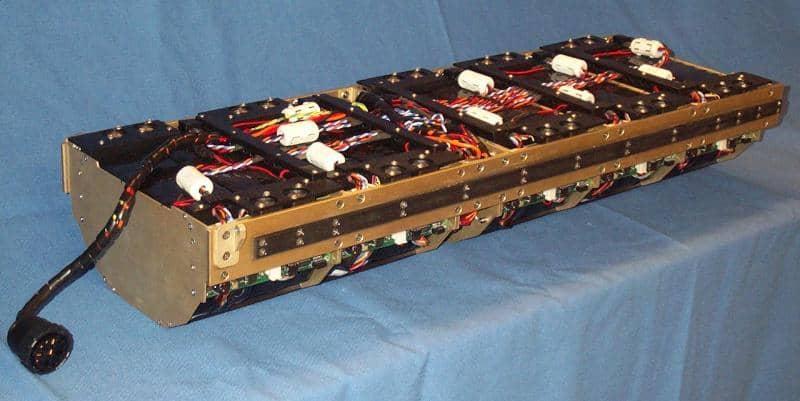
AUVs are typically powered by onboard batteries and therefore, like any electric vehicle, the available battery capacity defines the speed at which the AUV can travel and the range of the mission. Smaller AUVs are only capable of deploying for several hours, whereas AUVs with larger batteries can survey for several days with survey speeds around 1-2m/s (2-4mph) [2].
To increase the range of the battery and therefore the potential duration of missions, engineers are focusing on maximising the efficiency of UAV design. One of the key techniques to achieving this is to optimise the shape of the vessel’s body to minimise drag. This means there is less drag for the motor to overcome, demanding less energy from the battery and enabling the AUV to travel for longer. Extending the length of missions will allow researchers to explore more remote places such as underneath ice formations.
Case study: Using CFD to reduce AUV drag
Airflow Sciences Corporation
, a USA-based fluid dynamics engineering firm, were tasked with optimising the hydrodynamics of a new AUV concept. The main goal was to optimise the shape of the hull to generate the least amount of drag. To achieve this, a number of CFD tools were used to evaluate different designs and establish the one with the highest performance.
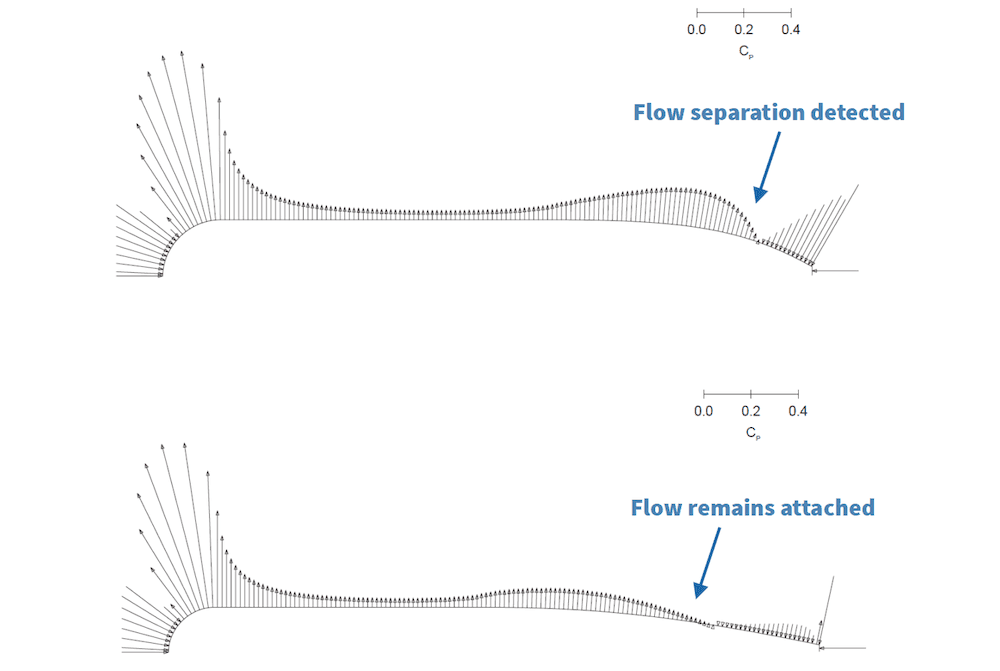
The first stage involved simulating the flow of a variety of hull shapes in 2D. This allowed a quick comparison between different designs and visually showed the behaviour of surface pressure and where the flow separates. As expected, the shape with the more gradual curvature showed much less flow separation, as shown below.
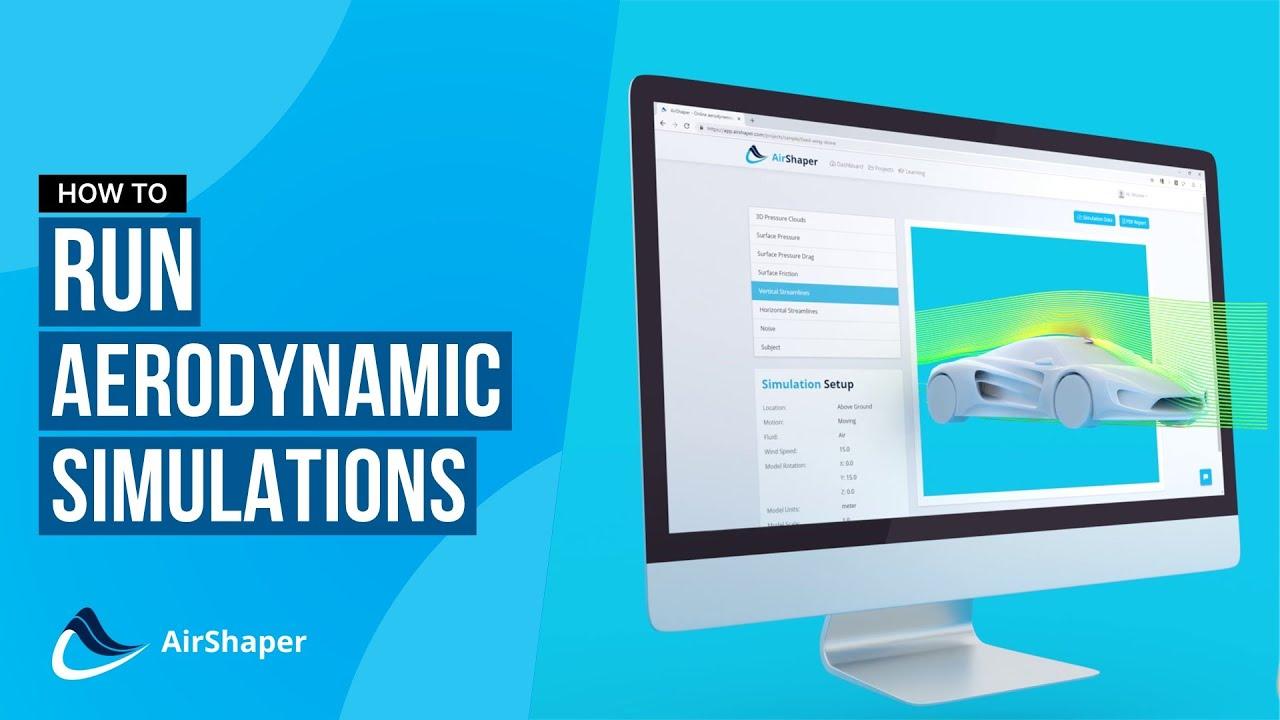
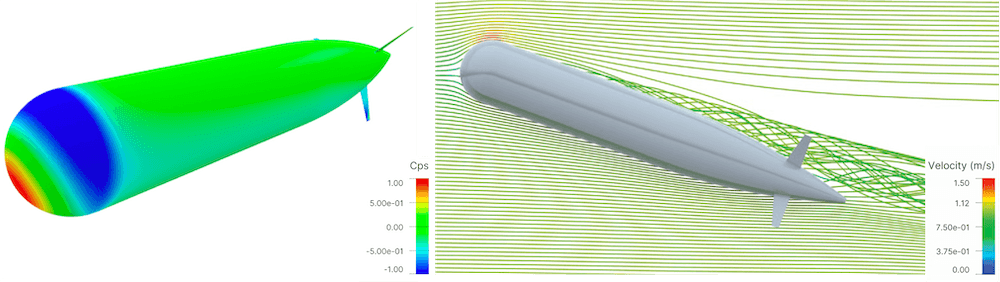
The hull design with the most potential was then developed into a 3D model and simulated in CFD using the web-based app AirShaper. This software automatically creates the mesh, runs the CFD simulation and consolidates the results into a PDF report which includes a range of plots such as total pressure, surface pressure, and velocity streamlines.
However, as this AUV design was a new concept and therefore there was no experimental data to use as a benchmark, Airflow Sciences decided to use several CFD solvers to analyse the results.
‘We felt AirShaper was a cost-effective way to obtain a comprehensive analysis of the OpenFOAM k-omega turbulence model,’ explains Robert Mudry, President and Airflow Sciences Corporation. ‘We wanted to validate the AirShaper results, but with no data available to compare against, we decided to run the same mesh, boundary conditions and turbulence model in two other independent CFD solvers; Azore and Fluent.’
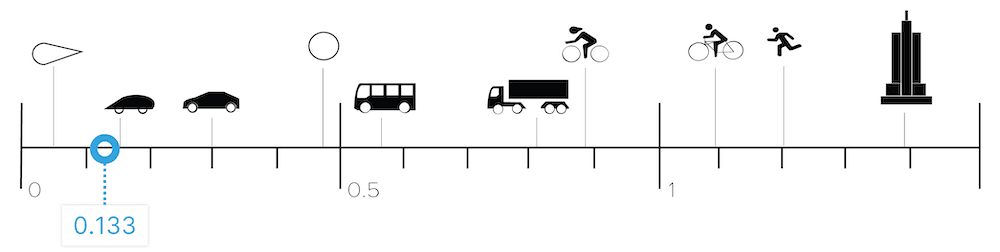
The results from the AirShaper simulation are shown below and the predicted drag coefficient of the optimised hull design was 0.133 in AirShaper, 0.128 in Azore and 0.143 in Fluent. ‘There was minimal difference in drag forces between the different CFD solvers and the variance of the drag coefficient figures was within an acceptable margin of error. This gave us confidence in the AirShaper software as well as in our hull design.’
Furthermore, as AirShaper also provided the numerical simulation files, Airflow Sciences could then conduct more detailed analysis as well as create custom graphics and videos using Azore.
‘We appreciate the opportunity to collaborate with Wouter Remmerie and the AirShaper team,’ concludes Mudry. ‘The simulation process using the AirShaper interface was straight-forward, the results were obtained quickly, and the report complete. We also liked the ability to import the OpenFOAM CFD results into the Azore post-processing software to create additional results in our corporate format. We are looking forward to more Airflow-AirShaper joint projects in the future.’
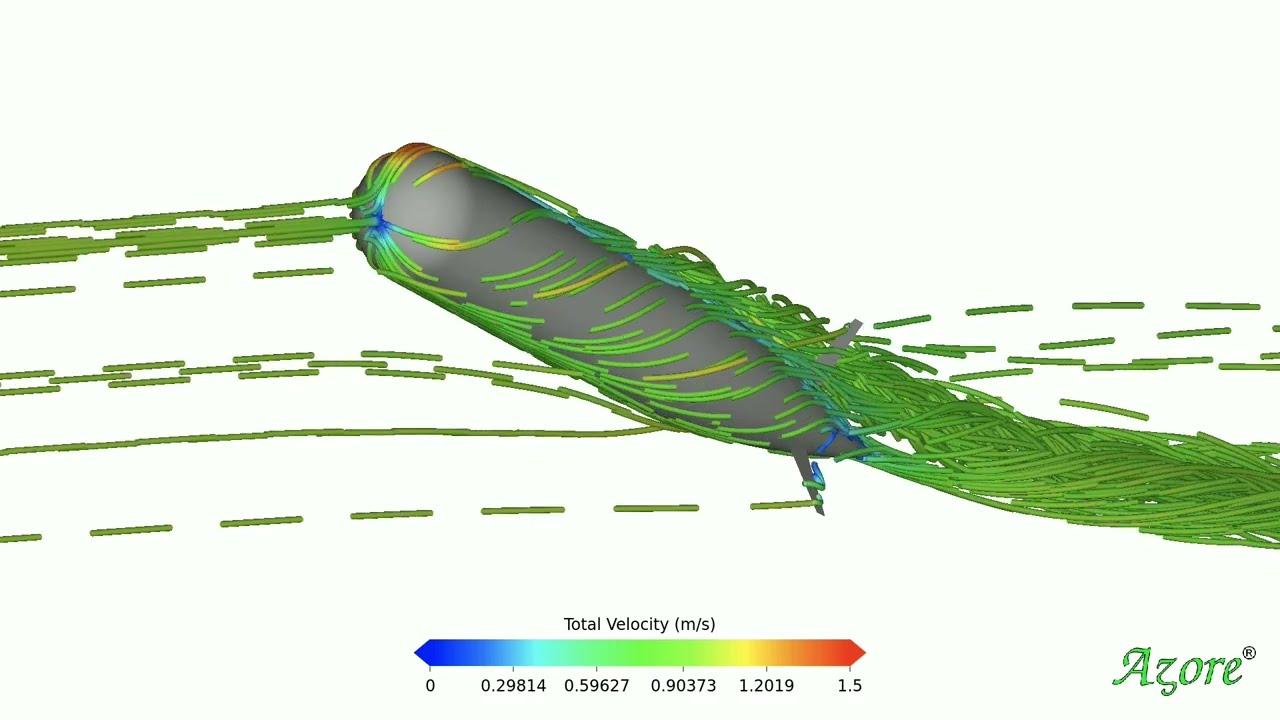
Animated pathlines of an AUV
Interesting links:
References
[1] 2020. Nearly a fifth of world's ocean floor now mapped. [Online]. Unesco.
[2] What is an AUV?. [Online]. VMS Virginia Institute of Marine Science.