
About the Author 📢
Vincent Keromnes works at A2MAC1, a company specialized in benchmarking the performance of cars. Lots of cars. Vincent is in charge of what they call "Dynamic Benchmarking", covering Kinematic & Compliance testing, Energy Management Strategy, Battery Thermal management and so on. Recently, they added aerodynamics & aero acoustics to that list - the perfect timing for a blog article!
Physical or Virtual Wind Tunnel? 🌬
We have several options to benchmark the aerodynamic performance of vehicles and we aim to get the best value out of each approach.
We analyze cars that are already available on the market. Running them through a physical wind tunnel test means you have the real shape (which can differ quite a lot from the digital mockup produced during development) in real wind conditions. But each wind tunnel has its own specific setup (attachment points, moving ground area, ...). This is ok when you're comparing the data with other vehicles tested in the same tunnel, but things get tricky when comparing with data from another tunnel or simulation data.
CFD (Computational Fluid Dynamics) simulations on the other hand can provide insights on digital models before the car is even built. Another advantage is the possibility to simulate real road conditions (without the limiations of a physical wind tunnel). But here too, comparability between different CFD methods is challenging, let alone the comparison to a wind tunnel test. The only solution for the latter is to include the full wind tunnel into the virtual CFD simulation.
In this blog, we'll compare the physical wind tunnel test with a CFD simulation applied on a high-quality exterior of the Tesla Model Y.
Physical Wind Tunnel Setup ⚙
We took the Tesla Model Y to the S2A wind tunnel for a thorough airflow analysis. This tunnel has been used for many cars in the past and features a moving ground (although it is limited to the area between the wheels) and allows for the wheels to rotate.
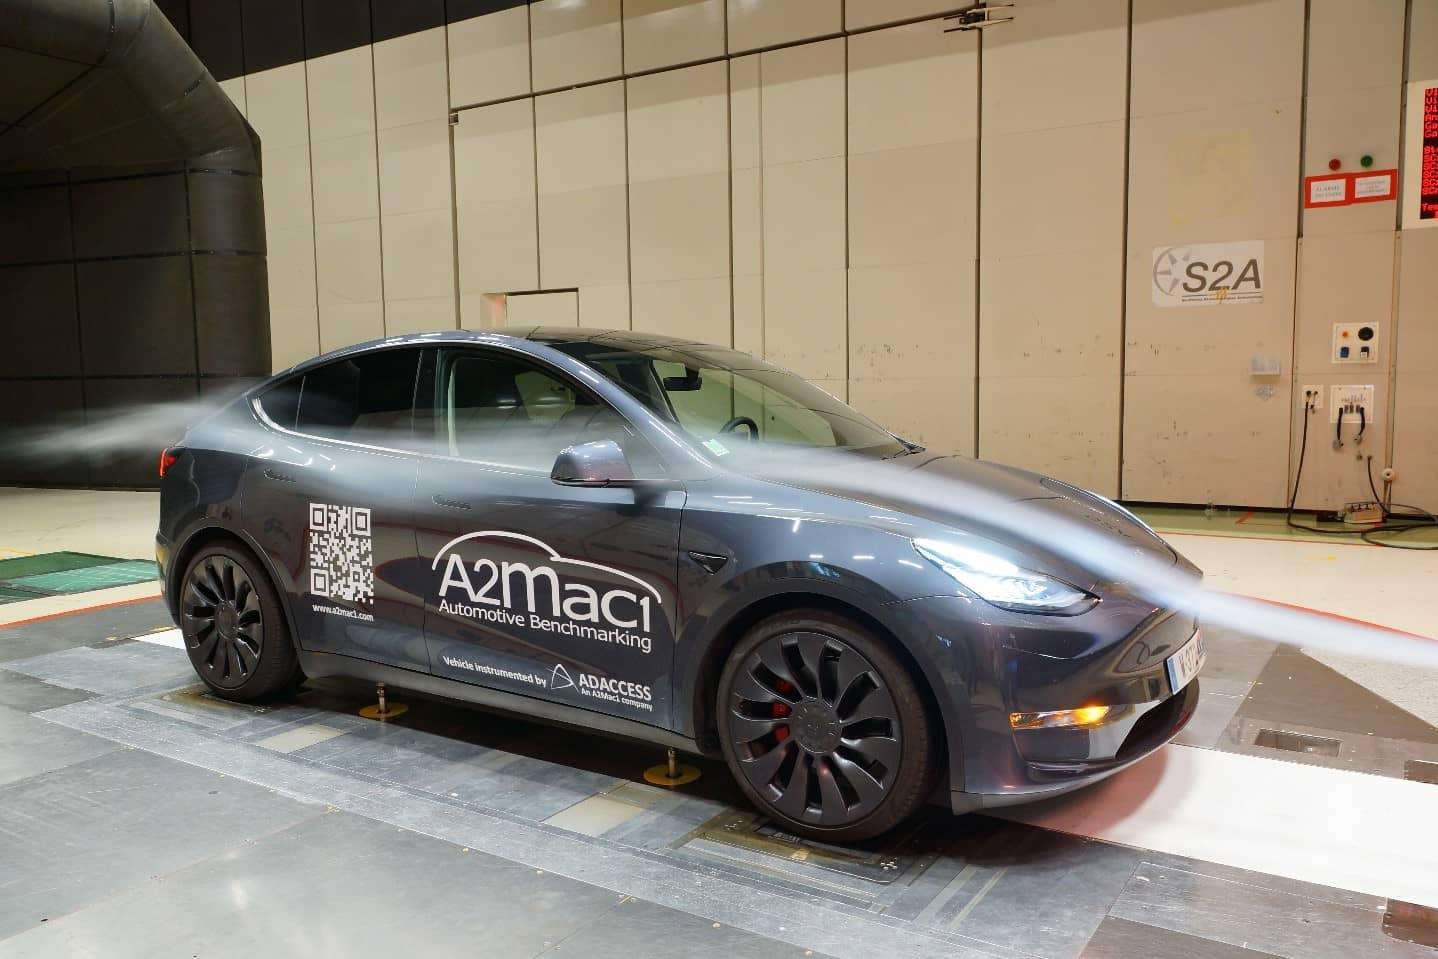
Using smoke the flow pattern of the wind around the car was made visible. And using special techniques, the total pressure in a plane just 100mm behind the car was measured, giving good insight into the structure of the wake behind the car.
The Virtual Wind Tunnel Setup 💻
To run a CFD simulation we needed a 3D model. In this case, a highly detailed scan of the exterior was made and then modified to increase realism: gaps between body panels were kept as geometrical discontinuity but were closed to avoid "false airflow" and the underhood flow was blocked by adding planes behind the grill. As for the aircurtains (small channels at the sides of the front bumper that provide a "shielding" layer of air across the front wheels), the inlets & outlets were part of the scan, but the duct connecting them to improve the flow was not (allowing for some air to escape "inside the car").
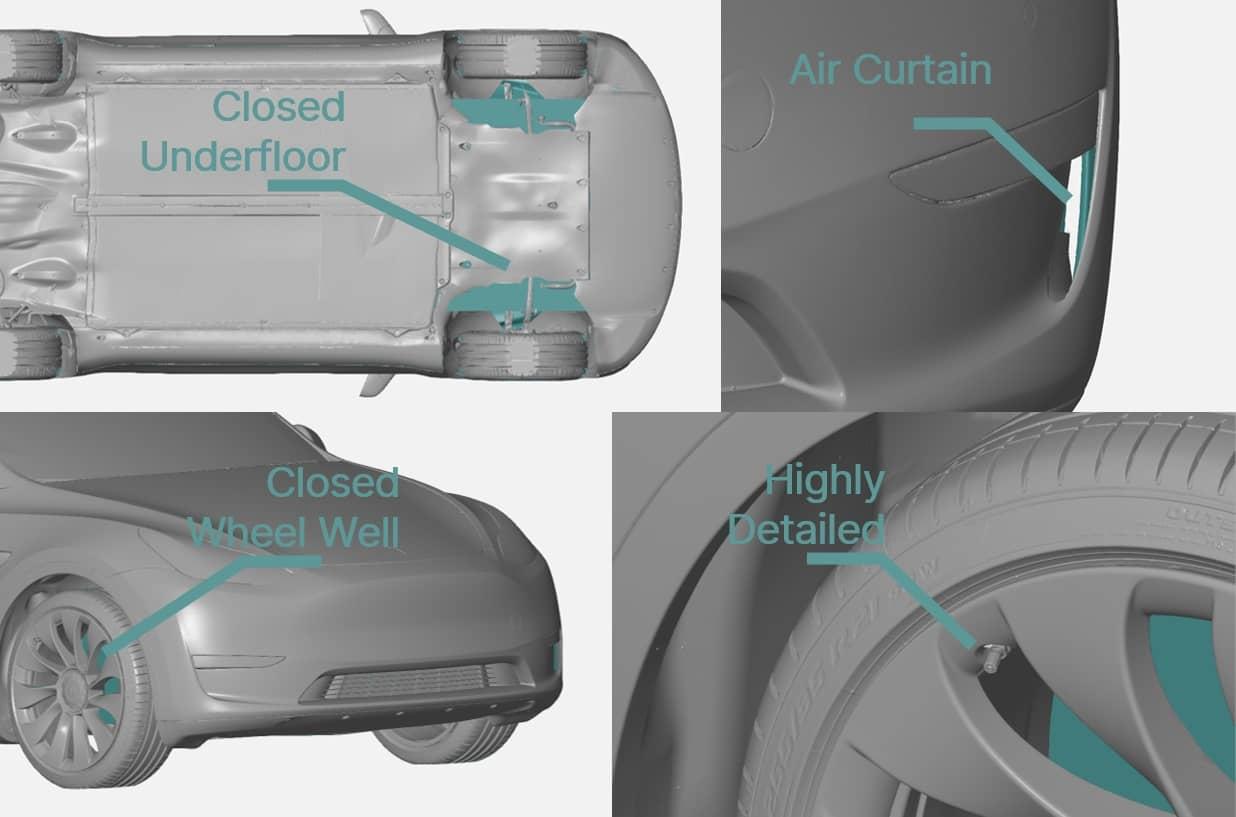
Once this was done, an AirShaper simulation was run. It also featured roating wheels and a moving floor (everywhere, not just between the wheels). The support arms used in for the wind tunnel test were not included.
Results 🖇
We can't publish the full AirShaper report and the full S2A report (as these are documents available for purchase at either company). What I can share is the following:
CdA: the AirShaper simulation predicts a CdA which is 5-6% higher than the wind tunnel result. This can have many reaons, but in part this is because of the missing aircurtain ducts in the 3D model (increasing drag in the virtual wind tunnel simulation) and the narrow moving floor (reducing drag in the physical wind tunnel test).
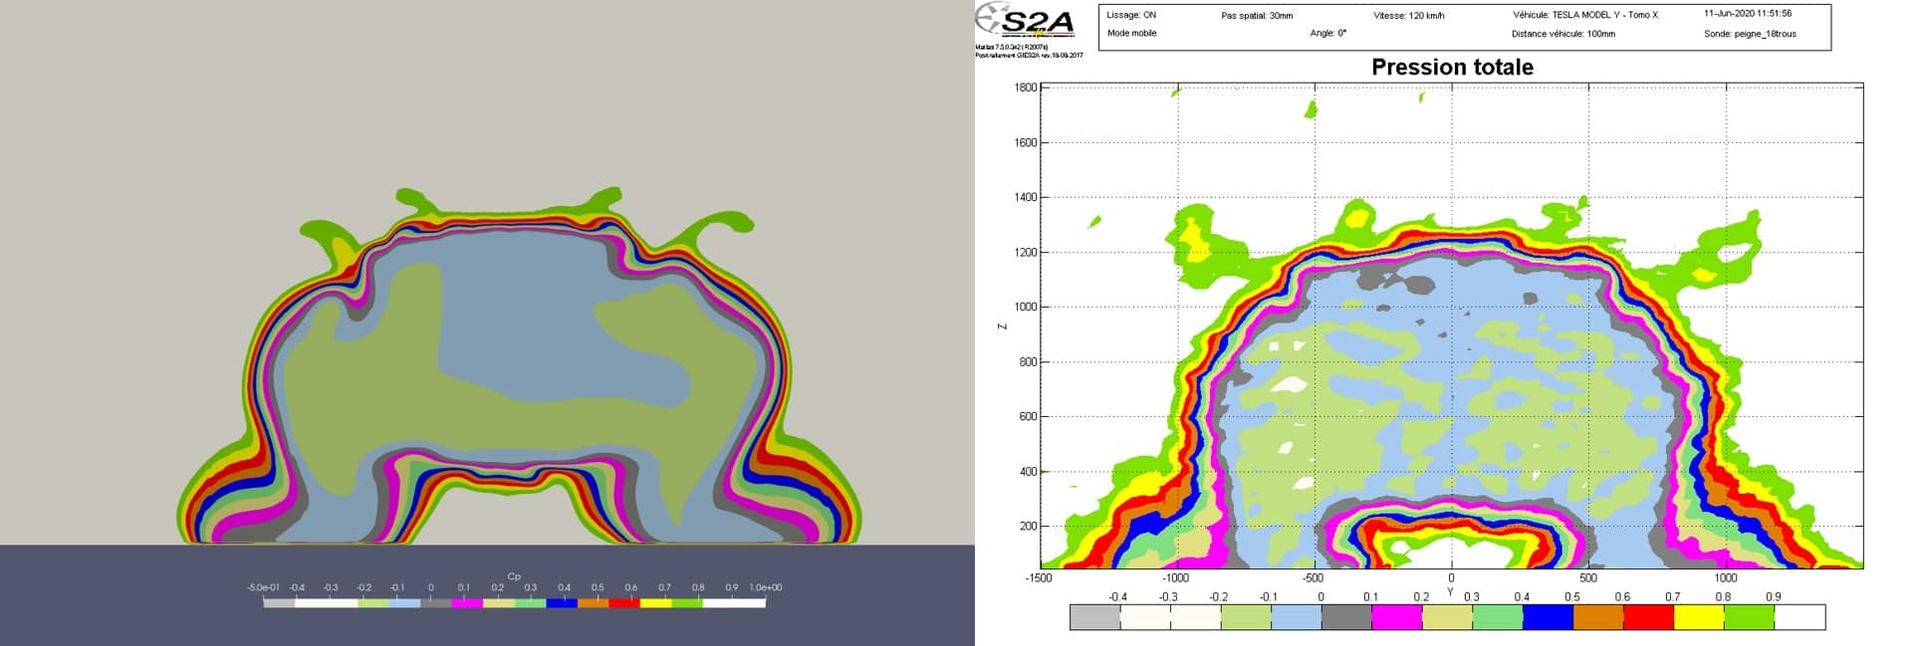
Pressure distribution: below you can see the pressure distribution in a cut plane taken at 100mm behind the car. The global shape is very comparable, confirming the complementary & correlation between both techniques, despite their differences in setup & execution. The largest differences are close to the ground, where the physical wind tunnel (narrow moving ground) and virtual wind tunnel (full moving ground) feature a different approach.
Cost 💲
Last but not least, I admit that the cost of doing a full vehicle scan and setting up a complete simulation manually yourself can cost as much as a physical wind tunnel test. By grouping all of these A2MAC1 scans & AirShaper simulations and offering the combined result to multiple users, the cost drops dramatically and understanding the aerodynamics of existing cars suddenly becomes much more accessible.
Conclusion 💡
I will not enter into a debate discussing the difference between the two approaches - I've been trapped in this kind of discussion too many times during my career - it would never end 😏. The real value of vehicle performance analysis is not in the absolute values: benchmarking is about relative differences, with the goal of ranking the performance of different cars.
The most reliable approach is to use a robust protocol and a set of best practices applied in a systematic way, consistently using the same tools (whether they are physical or virtual).
Start your own simulation here