
About the author
Michael Peinsitt is Skill Team Leader RACING at AVL, a company which has been involved in racing for almost 25 years with their in-house developed vehicle dynamics simulation tool AVL VSMTM RACE. Inside VSM, all components of the car are modelled and characterized, such as the suspension, the tyres, the engine, and many more. One area is particularly important towards achieving a good correlation between simulation and reality: aerodynamics. Modern race cars produce quite a lot of downforce, which strongly influences performance. And with downforce significantly varying with ride height, it’s important to map it properly in function of the car’s setup.
Mapping Aerodynamic Properties
When it comes to aerodynamics, the main challenge is to map downforce & drag in function of changes in input parameters. On top of the ride height, they also vary in function of the chassis slip & roll angle, the steering angle of the front wheels and so on. Grouping all of these correlations (or “sensitivities”) between aero coefficients and car setup results in what we call an Aero Map – a dataset of properties that can be used before & during the race weekend to setup & adjust the car in function of the track & the driver’s feedback.
The Options
One option to obtain these sensitivities is wind tunnel testing, but this is typically expensive and requires quite some effort. Additionally, rules in certain race categories prevent teams to use wind tunnels.
The second option is to perform aero measurements on the racetrack. Apart from the efforts to equip the car with the required measurement equipment, track testing is always subject to varying external conditions. Changes in for example speed and orientation of the wind, or air temperature, make it difficult to compare results from different runs. Plus, in similar fashion as for the wind tunnel testing, in many race categories the rules ban, or severely restrict track testing.
A third option is to use CFD calculations. To execute a “traditional” CFD workflow is also time consuming, as the preparation and the meshing of the CAD model usually requires a certain amount of manual effort, plus the execution of the calculation itself needs considerable computing power to be conducted. Once done, post-processing is needed to convert raw simulation data into meaningful figures & visuals.
To capture the influence of the various input parameters on aero performance, a significant number of runs is needed – which means it takes time until the results are available. With preparation time always being a premium in racing, having to wait for results can seriously reduce the competitiveness of a team.
Automating the simulation process
We turned to AirShaper to investigate the possibility of reducing or even eliminating many of the existing CFD challenges.
First of all, the need for “CAD-cleaning” – closing all gaps & holes in the 3D model of the car – can take a significant amount of time. AirShaper, however, runs directly on non-watertight 3D models, although in this particular example we had a watertight model available.
Second of all, we don’t need to worry about meshing, as this is entirely automated: the domain size, the initial mesh, adaptive mesh refinement, … are all included and, perhaps even more important, are repeatable. This means results between different models & setups are comparable.
Thirdly, we don’t need to manually post-process all the results. Frontal area, lift, downforce, aero balance, … are all post-processed automatically into a report. And using the online 3D result viewer, we can spot sources of drag, identify separation locations and so on. And if needed, we can always download the full results to do our own post-processing.
Benchmarking AirShaper
To verify how realistic the output of these simulations would be, AVL conducted a simulation project with a race car that had already been analyzed using a conventional CFD approach (manual meshing, running, post-processing).
The model used for the simulation was a touring car provided by AVL RACING. The car was set up to drive in a straight line (chassis slip & roll angle as well as the steering angle were set to 0).
The exact same 3D model was provided to AirShaper and within 24 hours, the platform churned out CFD simulation results.
The results
The first important comparison was a quantitative one, comparing the aerodynamic drag and lift coefficients. We were pleasantly surprised to see just a 5.2% difference in drag and an even smaller 3.6% difference in downforce.
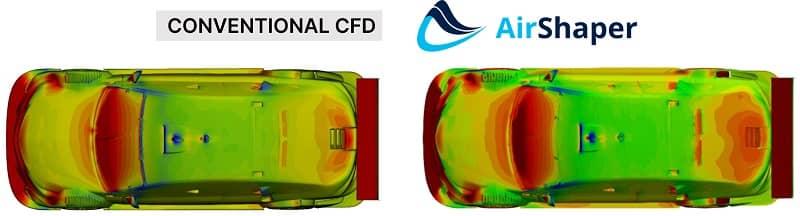
The second comparison was a qualitative one, comparing the surface patterns & flow structures in crucial areas on the car. A first example is the pressure map, which exhibits a near-identical pattern across both simulations.
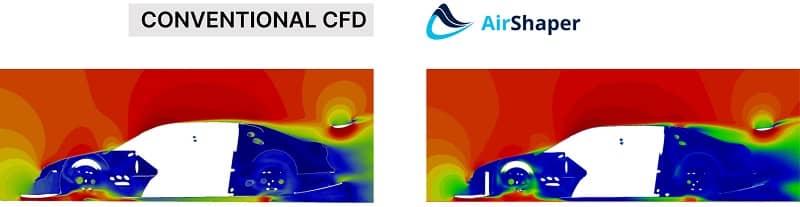
A second example is the local flow structure seen on a slice through the car, at 0.6m from the center. The way the flow enters the front wheel well, how it accelerates at the start of the diffuser, the velocity pattern around the rear wing, … all look highly similar.
Conclusion
For us at AVL RACING, as an engineering & software provider in the racing industry, it is extremely important to first validate new software tools before we offer them to customers. Through this validation project, we have gained insight into the capabilities of AirShaper simulations to help speed up the aerodynamic simulations for our customers. The good accuracy at a fraction of the cost & throughput time certainly makes AirShaper a viable option for future projects.
Interesting links:
AVLRace Car Aerodynamics
Run Your Own Simulation