What is wind tunnel measurement?
The fundamental aim of a wind tunnel test is to understand the behaviour of the airflow surrounding an object so that it can be improved to optimise aerodynamic performance. For an aircraft that means minimising drag and increasing lift, whereas for a Formula 1 car the goal is to reduce drag and maximise downforce.
To accurately measure the aerodynamic loads acting on an object and the characteristics of the airflow, a variety of techniques are used during a wind tunnel test. These can range from probes and pressure tappings to smoke and Particle Image Velocimetry (PIV) flow visualization techniques. In this article, we’ll run through each one and explain how they work and how aerodynamicists utilise them to improve aerodynamic efficiency.
Measuring aerodynamic forces
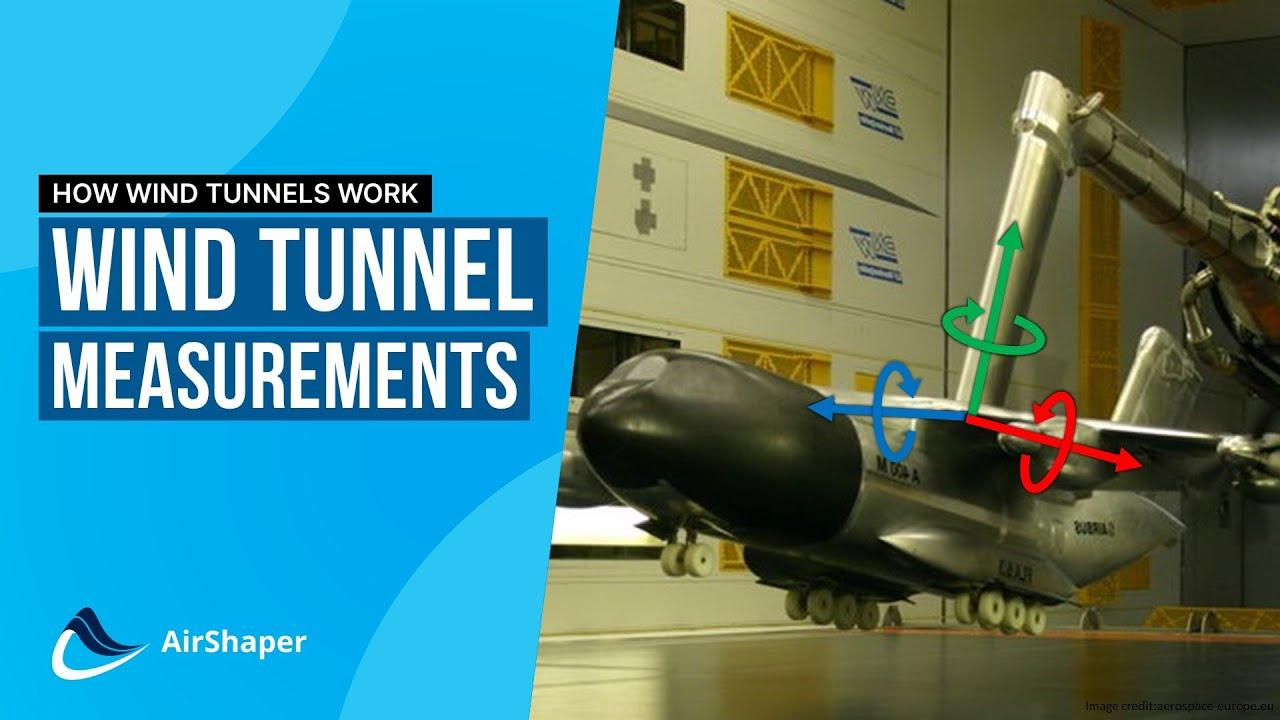
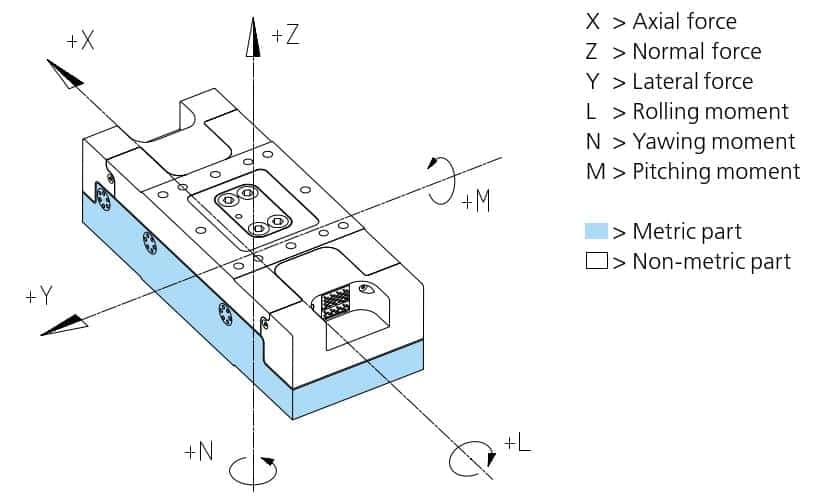
To accurately measure the lift and drag forces on an object, balances are used and have been a key part of wind tunnel testing since the 1870s. Balances are essentially a multi-axis force transducer that measure the forces (normal, side and axial) as well as the moments (pitch yaw and roll) an object experiences when subjected to an airflow.
In the past, balances used traditional weight scales to measure forces, whereas now these devices typically use strain gauged elements that convert loads into voltage signals. Along with the data acquisition, hardware and software, balances are calibrated to extremely tight tolerances. They will even be temperature compensated to try to achieve accuracies below 1N.
The technology behind pitot tubes
The main control variable of the wind tunnel is velocity. This has to be measured accurately and in multiple locations which is typically achieved with static pitot tubes.
These are metallic tubes that point directly into the oncoming flow. The small opening at the front allows air to flow into the tube, and as there is no outlet, the air comes to a complete standstill. This tube is connected to a pressure scanner which measures the stagnation or total pressure of the fluid.
Often, these pitot tubes also feature a ring of small openings, known as a static ring, on the side of the tube. These openings are parallel to the flow, so the flow is not slowed down, allowing the static pressure of the fluid to be measured. Both the total and static pressure can then be used in Bernoulli’s equation to calculate the velocity of the flow.
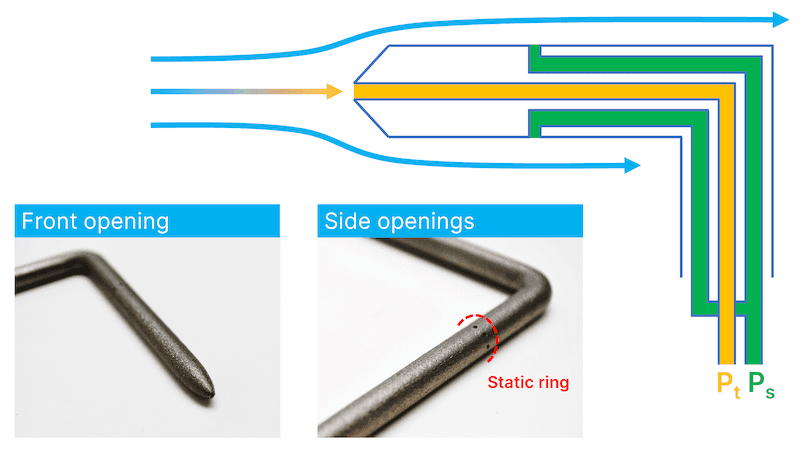
Pitot tubes work best when aligned with the flow, which is not a problem when the flow field is understood. However, if the direction of the flow is unknown then it is difficult to orientate the pitot tubes to achieve accurate measurements.
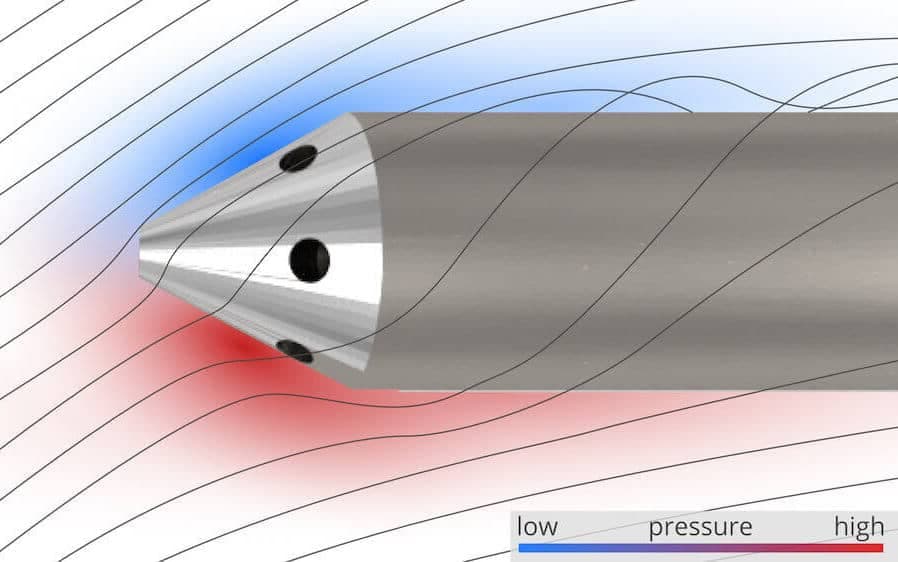
This is where multi-hole pitot tubes can be used. These devices essentially mount five pitot tubes in a cross shape. By measuring the pressure differential between these tubes, the direction of the flow can be calculated.
A closer look at kiel probes
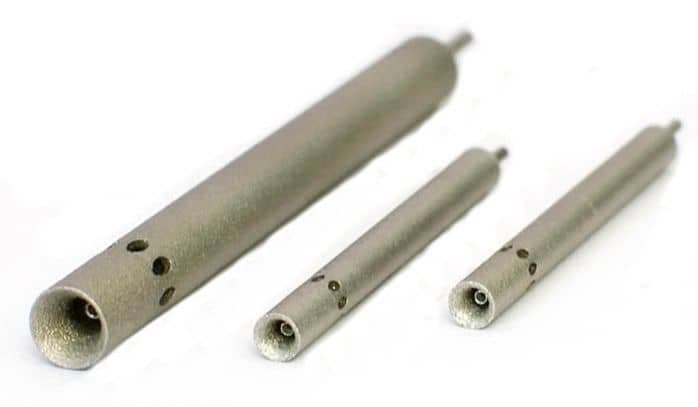
Another way to measure total and stagnation pressure at an angle to the flow is through kiel probes. These operate in a similar way to pitot tubes, but the inlet is protected by a shroud which makes kiel probes less sensitive to yaw angles. This is why kiel probes are often used in pressure rakes in wind tunnel tests or on Formula 1 cars, because they can accurately measure pressure in turbulent flow fields.
Flow visualisation techniques: Wool tufts
Measuring the aerodynamic forces is only a small part of what aerodynamicists want to understand about the air flow and offer little insight into the flow mechanisms at work. For example, an average load measurement may miss the fluctuations that come from an unsteady flow that is detaching and reattaching from a surface.
Visualisation techniques can be used to help show the behaviour of the flow and have been around for a long time. The simplest of these is wool tufts which are small sections of lightweight, flexible yarn that are attached to the surface of an object. During a wind tunnel test, if a tuft is swept back and flush to the surface it indicates clean, attached airflow. Whereas if a tuft is rapidly changing direction then this could signal flow separation.
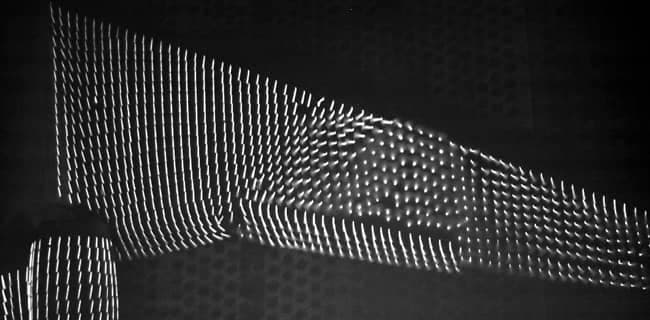
Aerodynamicists attach hundreds of wool tufts to an object’s surface and use high resolution imagery and videos to compare the behaviour of the tufts under different flow conditions. This can give valuable insight into where the flow is separating.
Flow visualisation techniques: Smoke jets
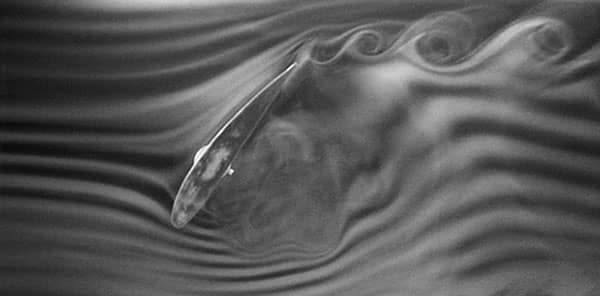
Smoke jets are another useful visualisation tool, although can be quite difficult to manage, particularly in closed-loop wind tunnels. Eventually the build up of smoke requires a full air purge from the system.
Flow visualisation techniques: Flow viz paint
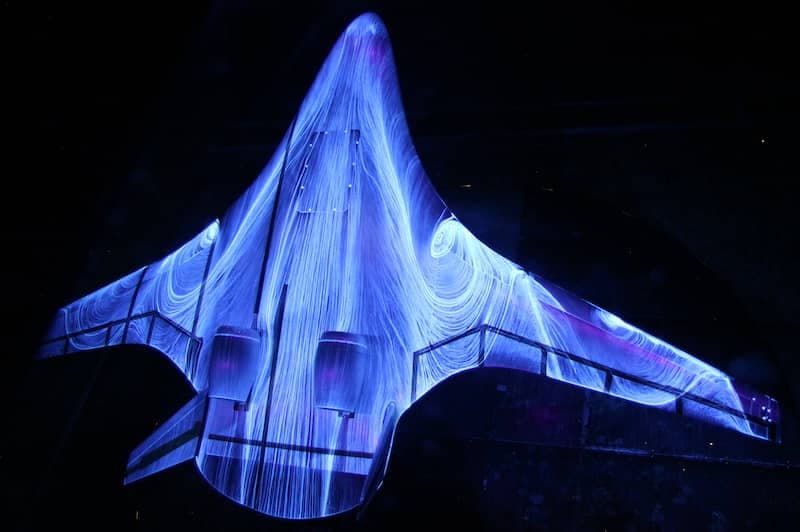
Flow visualisation paint is effectively a coating made up of oil such as paraffin and a fluorescent pigment. It is applied directly to the surface of interest and as air flows over the surface, it disturbs the flow viz paint, forming patterns on the surface which indicate the behaviour of the airflow. This is often used on racecars during testing or practice sessions as well as in wind tunnels.
Flow visualisation techniques: PIV
The downside of these visualisation techniques is that there is only so much value aerodynamicists can extract from a series of still images. It is difficult to quantify any accurate measurements from pictures of flow patterns.
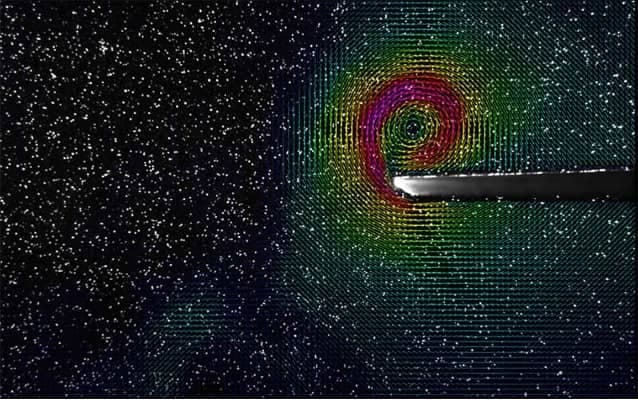
Particle Image Velocimetry (PIV) can help solve this problem. Using this technique, the air is seeded with particles which are illuminated by a laser sheet positioned perpendicular to the flow. The particles are sufficiently lightweight to be carried by the flow, preventing them from influencing its behaviour.
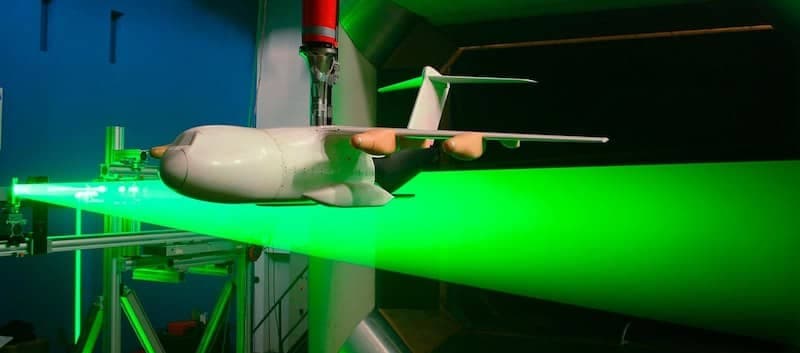
The system takes two images of the area of interest, at a short time step apart, as it is illuminated by the laser sheet. Software is then used to identify each individual particle in the first image and then compares this to the second image to identify the most likely position of each particle in the second image. This establishes how the position of each particle changes between the images and with the timestep known, the direction and velocity of each particle can be calculated.
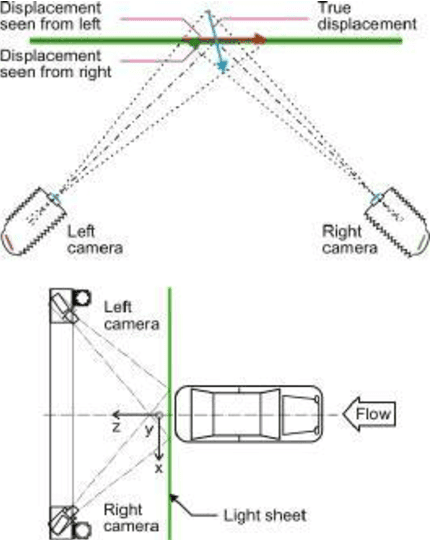
The addition of a second camera adds an additional dimension, namely movement along the flow path to give full 3D flow metrics. The software behind all of the processing is a closely guarded piece of IP by each system provider. The hardware is more well known, advancing as digital camera technology improves.
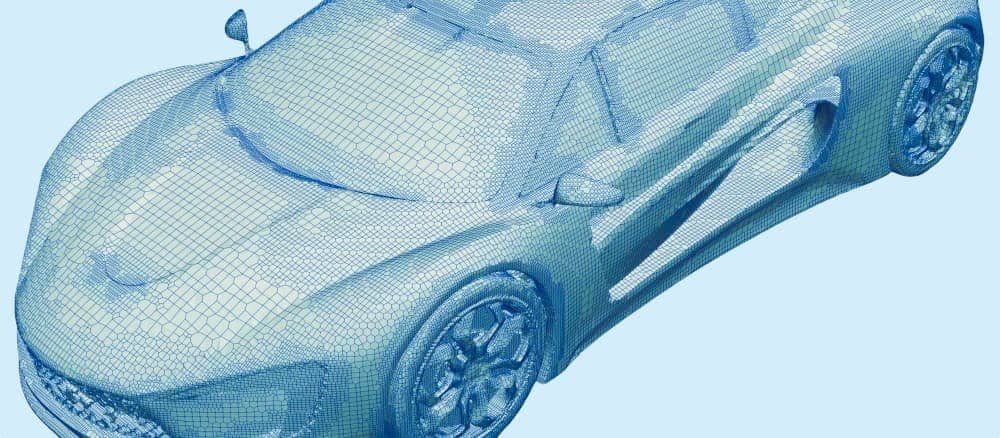
With all of this information, the full flow field can be displayed and directly compared to CFD images. It is possible to do this work using kiel probe rakes, but PIV has the advantage of having no physical parts in the airflow. There is always a danger of probe rakes affecting the very flow fields they are supposed to measure.
