Ever wanted to test the aerodynamic design of your own car?
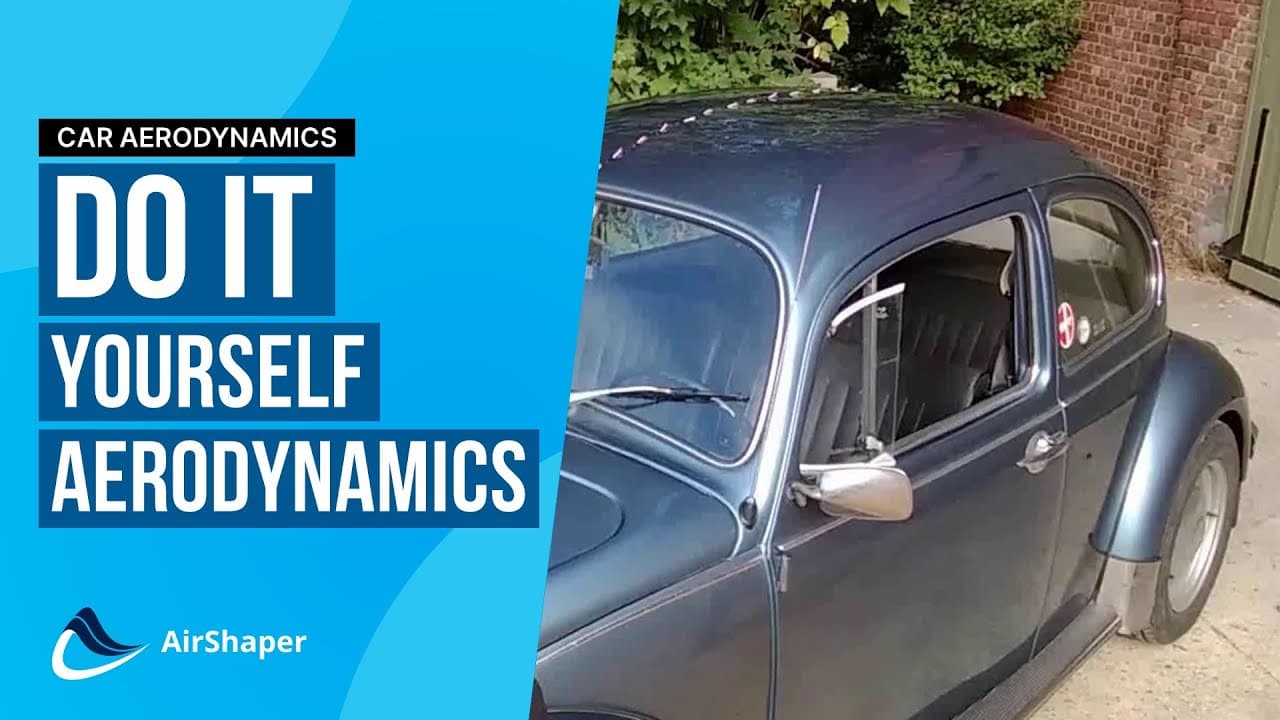
This article will explore the easy, affordable and effective flow visualization techniques that you can use. To demonstrate how, we've conducted a few tests of our own on a 1970's Volkswagen Beetle.
What is flow visualization?
When a car is moving, it's difficult to visually understand the interactions between the car and the surrounding air. Flow visualization is often a useful cost-effective way of understanding the qualitative flow patterns and fluid properties around a vehicle.
Although flow visualization does not replace real data when analysing aerodynamic performance, it can provide insight into which aerodynamic devices are working and why. It can help distinguish areas of clean airflow from areas of turbulence or flow separation.
Flow separation
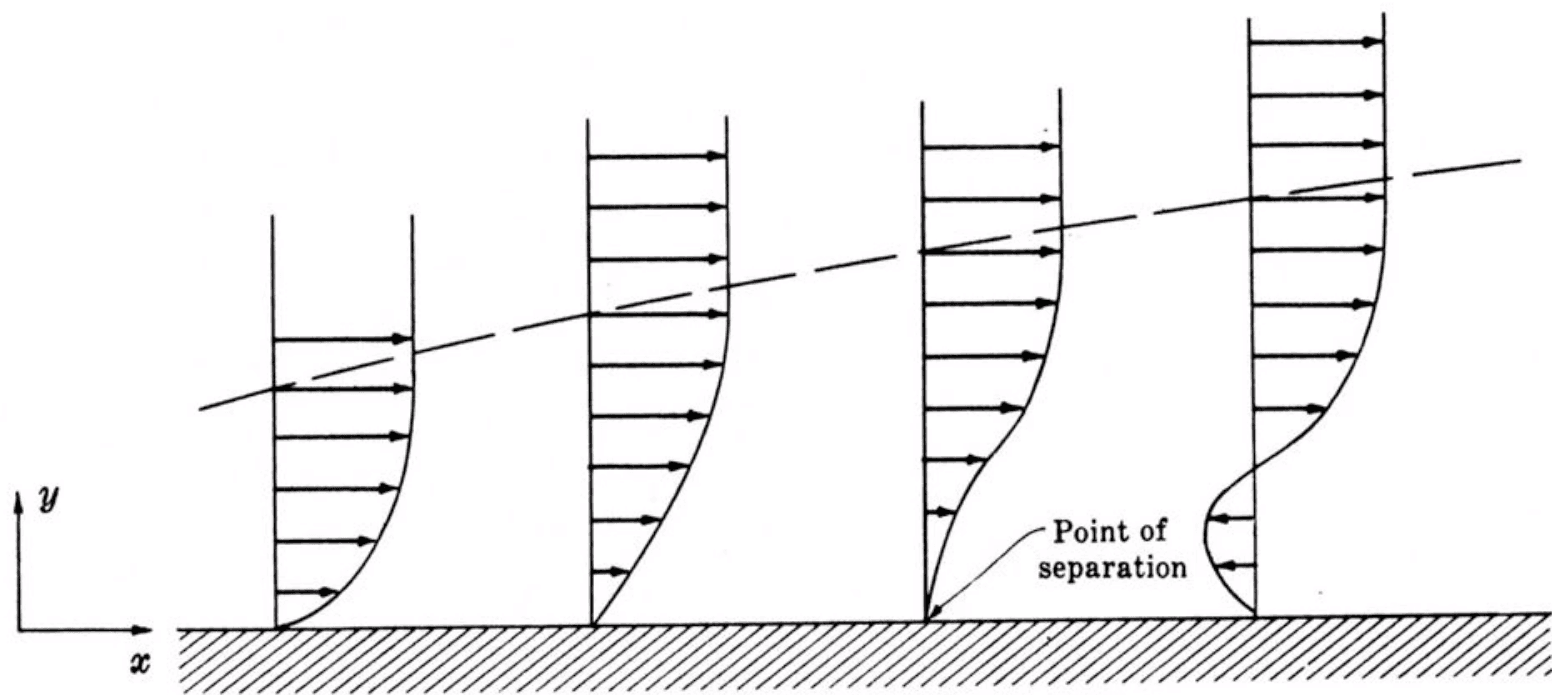
Flow separation occurs when air can no longer follow the contour of the object it is flowing past and so it physically separates from the surface. This can sometimes happen if there is a sharp change in the geometry of the part. Quite often though, it is caused by an adverse pressure gradient.
Fluids flow from areas of high pressure to areas of low pressure. This is known as a favourable pressure gradient because the airflow willingly moves to the low pressure zone. Whereas an adverse pressure gradient occurs when air is forced to move from a low pressure zone to a high pressure zone. This requires energy and will slow down the flow near the surface.
At some point, the flow will slow down so much that it changes direction. This is known as the separation point, past which the flow will be unable to follow the surface profile. Flow shapes that feature steep adverse pressure gradients are much more likely to experience flow separation.
Adverse pressure gradients are common in areas where the volume of air undergoes expansion, such as the downward slope of a car’s roofline. According to the Venturi effect, as air expands from a narrow cross section to a wider cross section, its velocity decreases and its static pressure increases. This creates an adverse pressure gradient.
Tufts
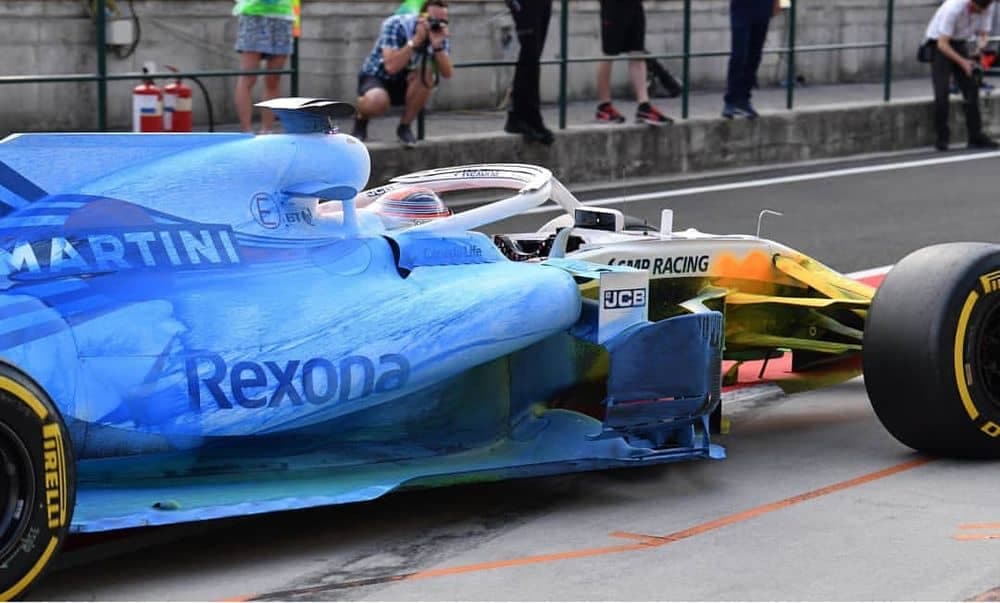
One popular flow visualization method is the use of tufts. These are small portions of lightweight string that move around with the wind and are an excellent way to visualize airflow in the real-world environment as well as wind tunnels. By attaching tufts to the surface of an object, you can observe their movement and begin to understand how air behaves as it travels around an object.
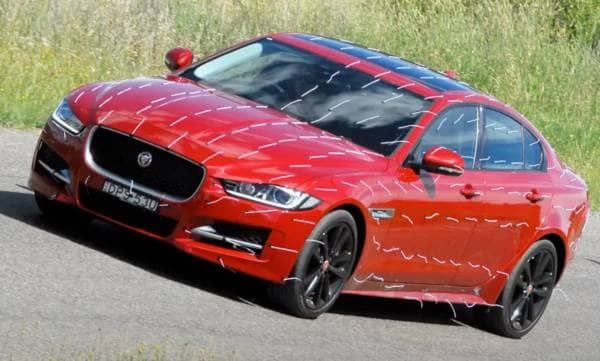
If the tufts remain still and stuck to the surface, this suggests that the nearby airflow is clean and attached. If the tufts move around erratically then this indicates turbulence or flow separation.
Flow-vis
Another easy to use flow visualization technique is flow-vis paint. This is normally created by mixing a brightly coloured pigment in a light oil, which can then be applied to the surface of interest. As the vehicle increases speed, the oil moves with the airflow before evaporating. This leaves behind the colour pigment which highlights the direction and quality of the airflow on the surface.
Volkswagen Beetle demonstration
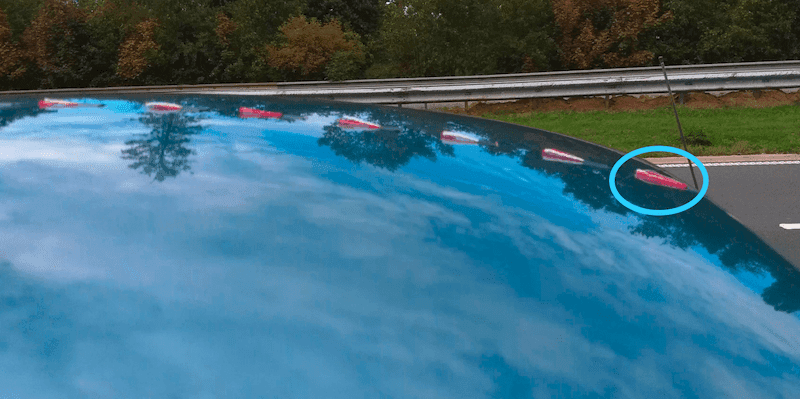
The video above demonstrates how to test the aerodynamics of your vehicle using only tufts and a camera. Our test vehicle is a classic 1970’s VW Beetle and tufts have been placed 10cm apart along the centreline of the roof. The aim is to learn how the airflow behaves as it follows the curvature of the roof and rear window.
Analysis
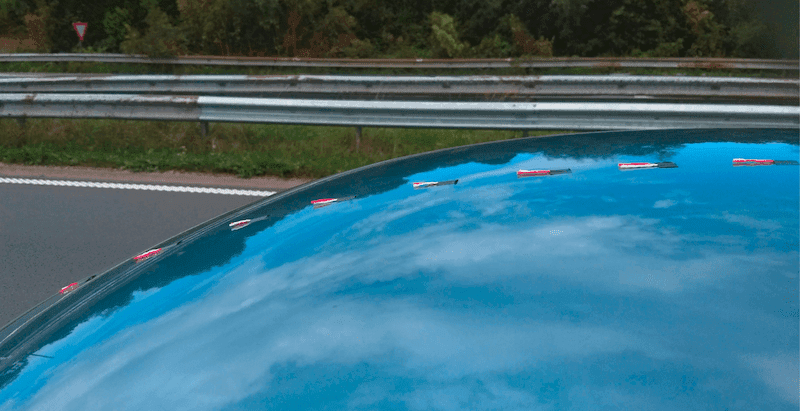
On the front test section of the roof, the first tuft displays some nervous movement. Although not very pronounced, this does suggest minor turbulence. It is possible that the sharp angle between the roof and windshield cause a temporary detachment of the local airflow.
Towards the rear of the roof, all the tufts stayed stable and attached, showing that the flow reattaches and remains stable.
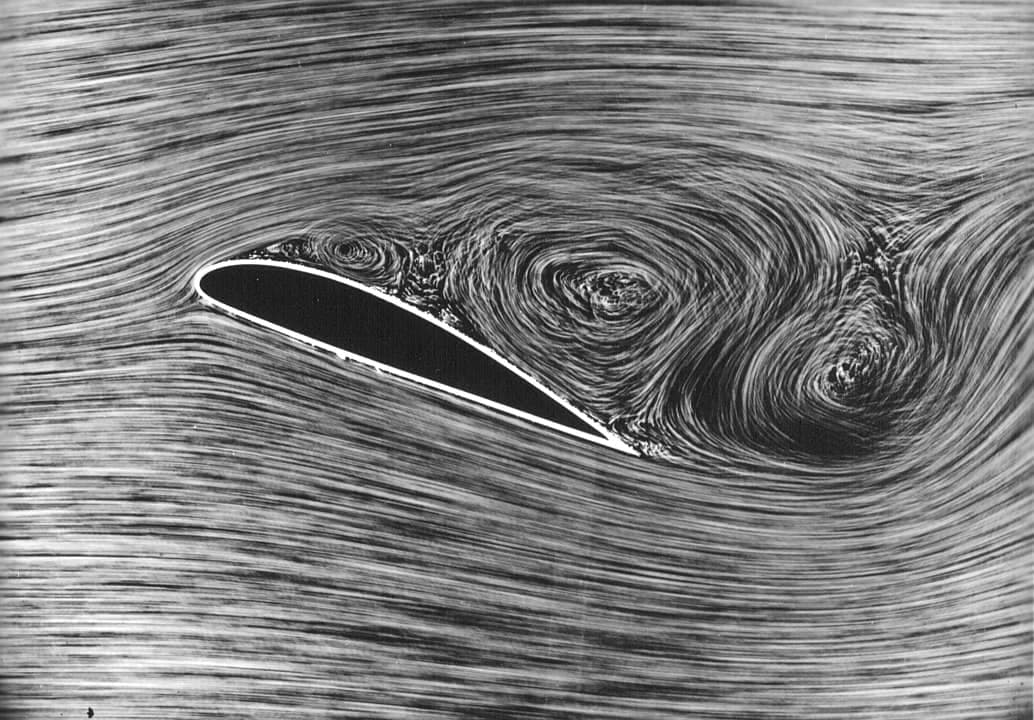
On the rear window, the tufts moved erratically, indicating flow separation. Even though the rear roofline is smooth, the downward slope creates an adverse pressure gradient that is too steep for the air to follow.

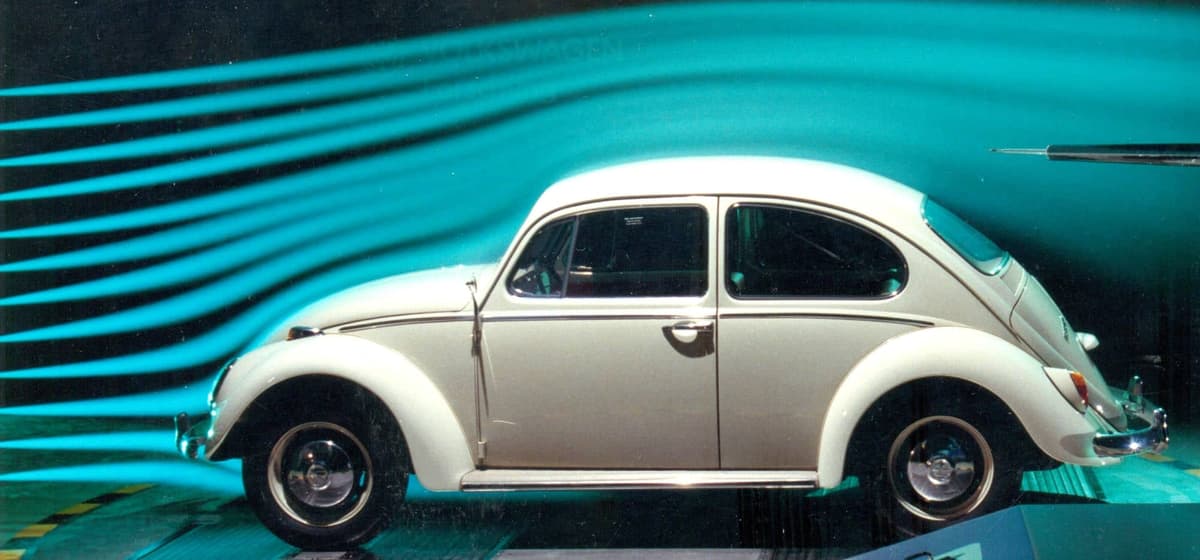
These same effects can be seen in the wind tunnel test of a similar Beetle pictured below. Since the air is unable to redirect itself downwards, it continues a more horizontal trajectory. This leaves a low pressure wake directly behind the vehicle, generating a significant amount of pressure drag.
Tips for carrying out your own aerodynamic tests
Tufts and flow-viz testing are useful ways of indicating the surface flow patterns on your vehicle. However, these techniques don't visualize the 3D flow structures created, and are therefore not the final word in determining aerodynamic performance. That requires controlled testing with specialized equipment to accurately measure downforce, drag and other key variables.
However, this does not diminish the value of flow visualization. Even if you don't know the specific drag coefficient of a rear wing, a tuft test can quickly show whether the airflow has remained attached. In this way, they serve as a litmus test to determine which aerodynamic components are working.
Optimize aerodynamic performance with AirShaper
Flow visualization is a great way to test the performance of an existing vehicle configuration. However, iterating and testing several physical prototypes can quickly become expensive and time consuming.
Computational Fluid Dynamics (CFD) simulations are now the industry standard for predicting aerodynamic performance, but software can be expensive and difficult to use properly. Airshaper makes aerodynamic design accessible to all with its cloud-based virtual wind tunnel software. All you need to do is provide a 3D model and we'll help you maximize performance with a simulation report packed with detailed results and insights.
Find out how to run an AirShaper aerodynamic simulation and get started today!