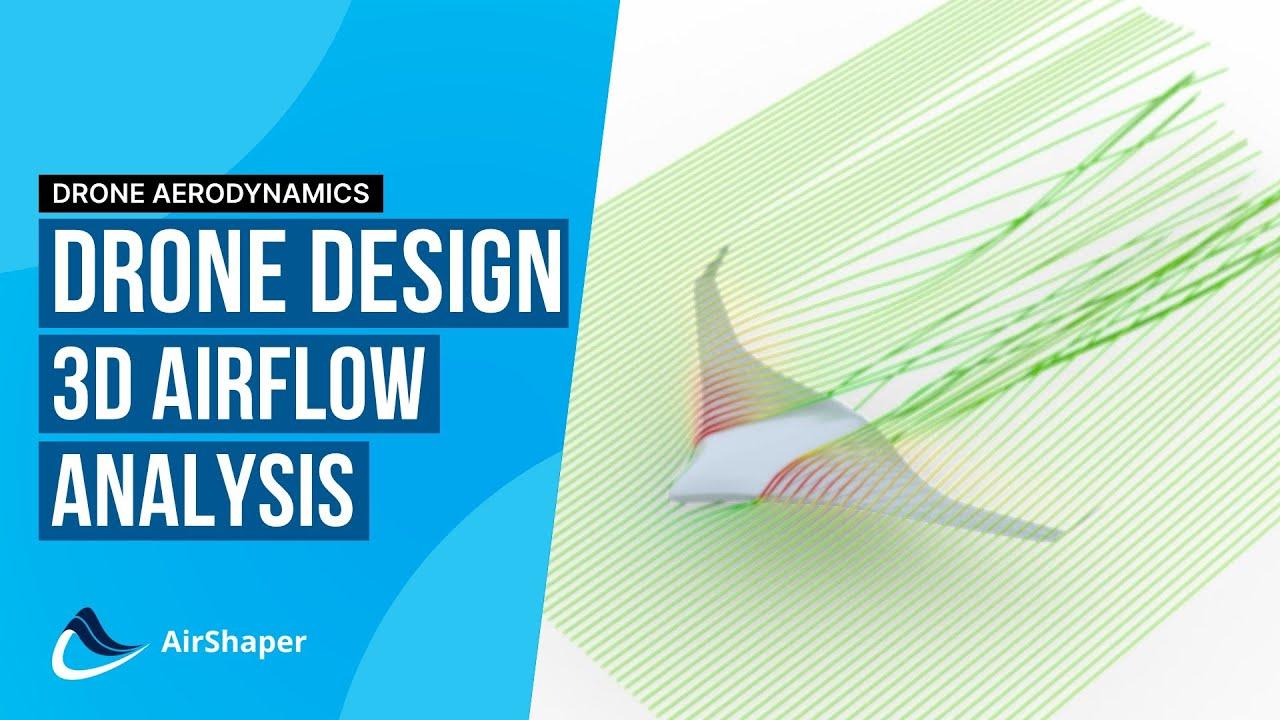
How can you use CFD to analyse and improve the aerodynamic performance of a fixed wing drone?
In our previous article on airfoil design for unmanned aerial vehicles, we discussed what to consider when selecting an airfoil profile for a drone. Now, we will take an existing drone design and analyse it's performance using CFD. We will also explore the different ways to examine analysis results and gain insight into the drone's aerodynamic behaviour.
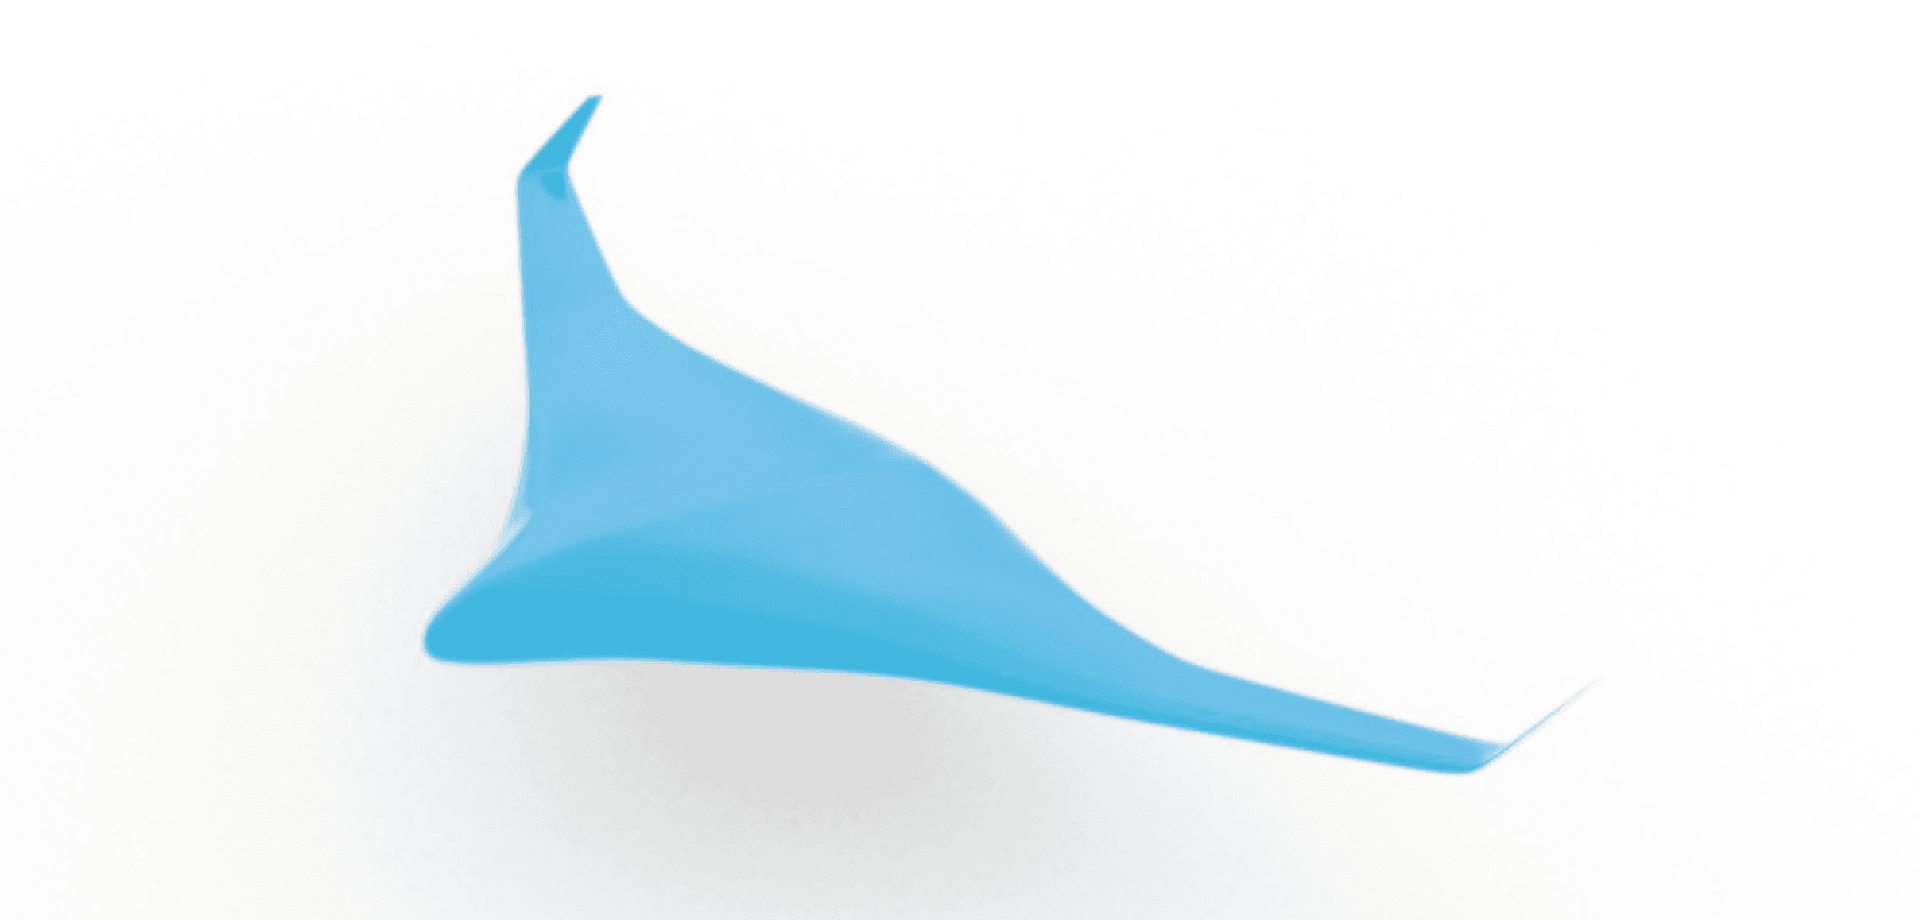
The drone
We will be exploring the design of a generic fixed wing aircraft using Airshaper’s online simulation platform. In the video above, you can see how easy it is to run your own simulations. All the results presented in this article are from a simulation report that is automatically generated with every AirShaper simulation (for regular simulations and above).
The simulation was run at an air velocity of 15m/s. The drone was also oriented at 15 degrees angle of attack. This is a very aggressive orientation, which will hurt efficiency. However, it will also create more interesting flow results for us to analyse.
Preliminary results
At the test speed, the drone generated 21.61N of lift, and 4.94N of drag. This equates to a lift to drag ratio of 4.37. The airfoil profiles analysed in the previous article on airfoil design generated ratios well over 100, which means this performance is not particularly impressive. To understand why, we will need to take a closer look at the simulation results.

Analysis techniques
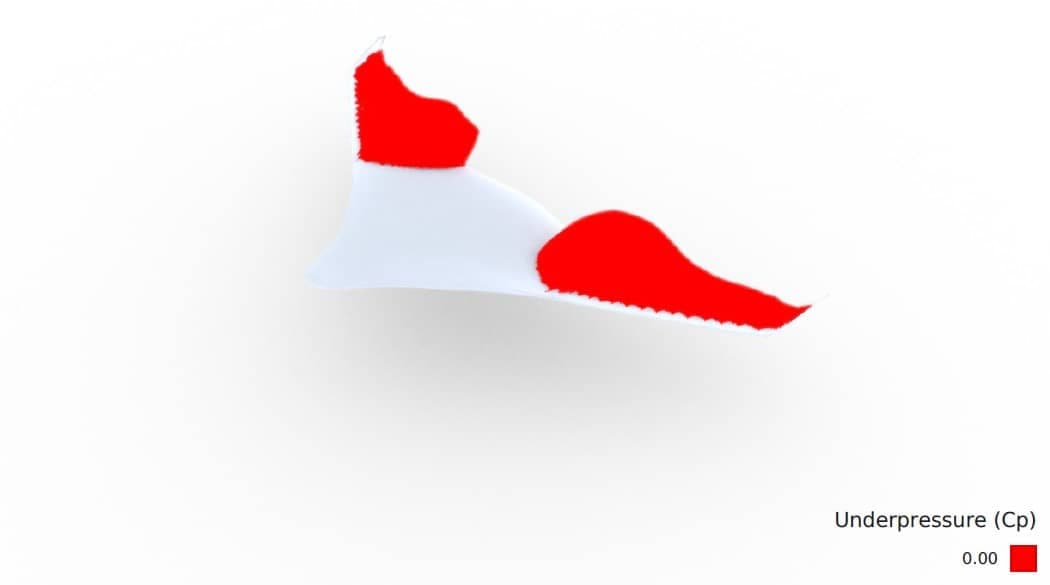
First, we'll analyse the total pressure coefficient which is a measure of the total energy present in the flow and is the sum of the static and dynamic pressures. A value below zero is usually an indication of a wake zone and subsequently a source of drag.
The image below shows the boundary where the total pressure coefficient equals zero. The outer parts of the wings are creating a significant wake.
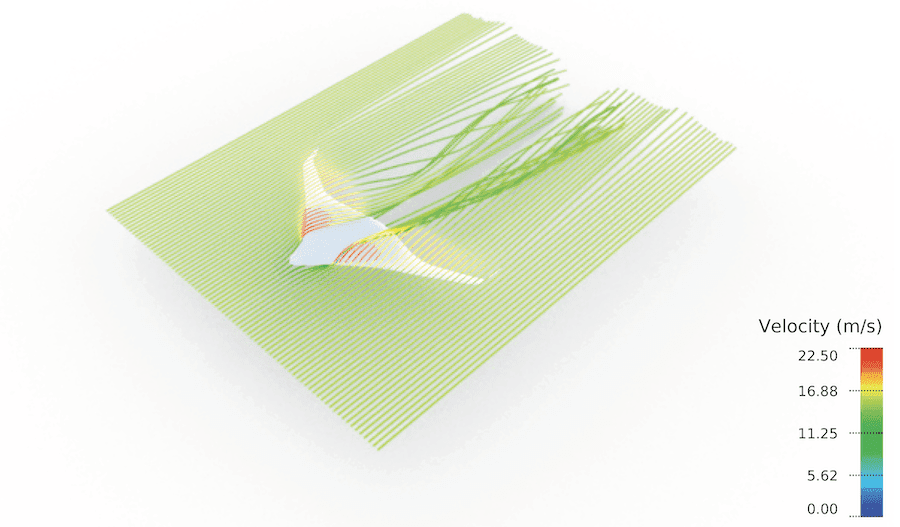
Another useful visualization tool is the surface friction plot from a top side view, shown below. In a previous article on flow visualization techniques we discussed how adverse pressure gradients can lead to flow separation. The green areas in the plot below indicate the area where the flow separates. It can also be seen that the flow can reattach within those boundaries as it circulates within the wake.
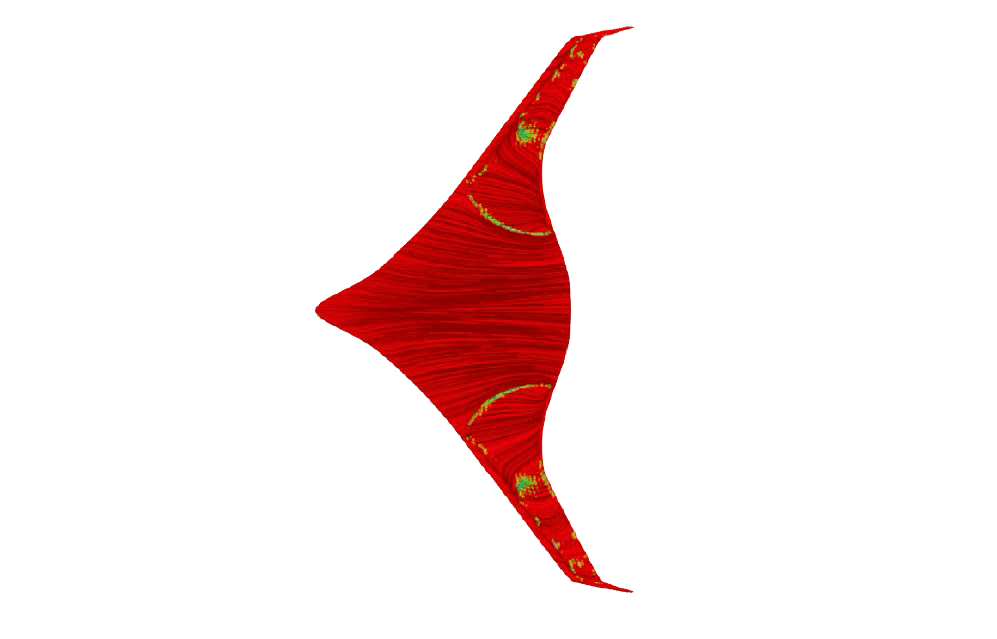
These display areas of low surface friction, indicating detached (or separated) flow. A close inspection of the streamlines reveals that the air is moving erratically in different directions. This is the same behaviour we observed on the rear window of the VW Beetle wool tuft test.
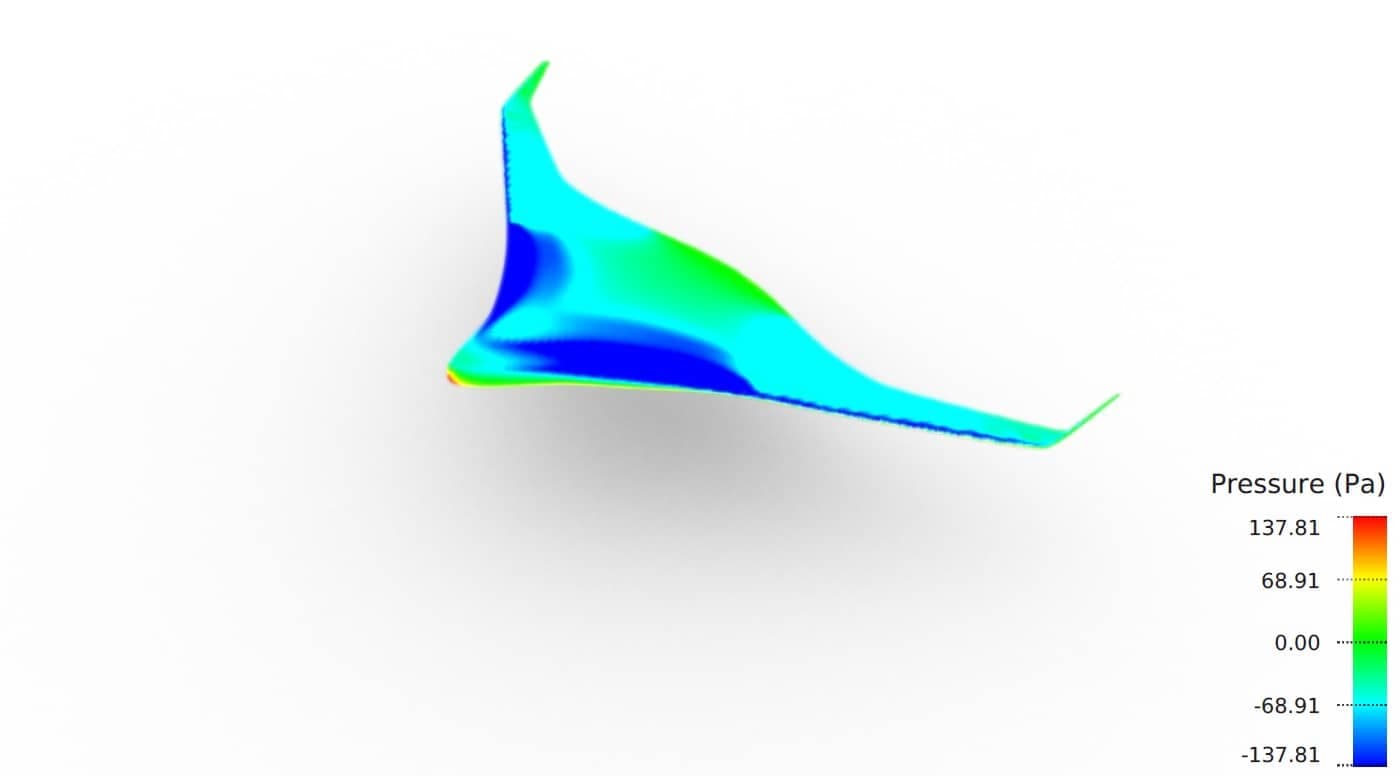
Further evidence of flow separation can be found in the surface pressure map below. To generate lift, a wing must have low pressure on its top surface and high pressure on its bottom surface.
The dark blue area over the centre of the drone indicates high-velocity, low-pressure flow. At the outer parts of the wing, the relative pressure is higher. This suggests that air separation occurs right after the leading edge, resulting in slower, higher-pressure air.
After analysing the various results from our drone simulation, we now have a good understanding of the drone's aerodynamics. The centre section is performing well, but the outsides of the wings are experiencing significant flow separation. Now we need to find out why this separation is occurring.
Interpretation of results
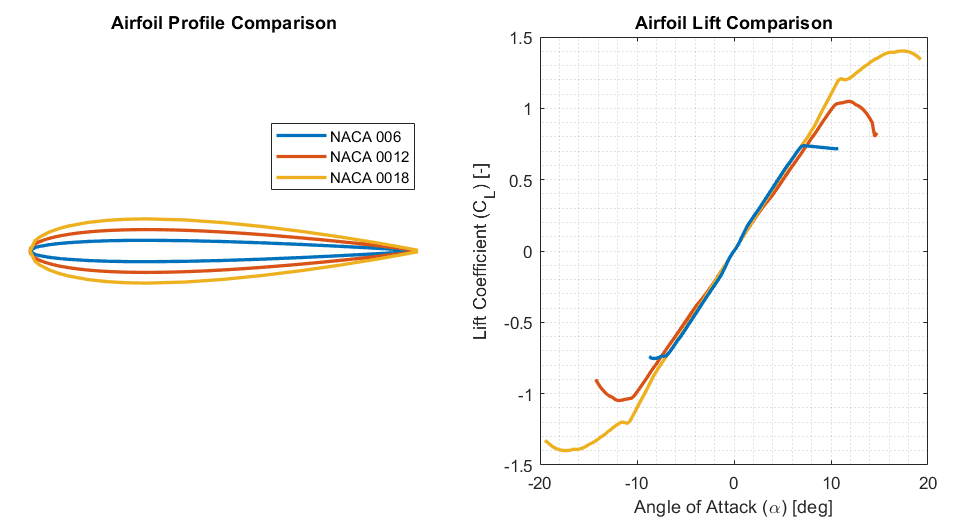
There could be several theories on the cause of flow separation near the outside region of the wings. First, let's consider the dimensions of the airfoil. The relative thickness is highest in the centre and tapers out to the sides. Airfoils with high relative thickness typically achieve higher angles of attack without stalling.
We can see this when comparing the lift curves of the NACA 006, NACA 0012, and NACA 0018 airfoils. These maintain the same basic profile, varying only in thickness.
It is also important to consider the shape of this fixed wing drone frame. When viewed from above, there is a clear triangular platform as the wings sweep backwards. This means air that hits the nose first will get pushed out to the sides.
As it bends round to the upper surface, it is pushed back to the centre to fill the wake and prevent separation. The result is a net inward and upward motion of the airflow. This can effectively increase the local angle of attack near the outer parts of the wings, triggering an early stall.
Conclusion
The CFD results showed a loss in drone performance from flow separation, which could be caused by the design of the drone itself. Of course, the next question is how can this flow separation be prevented?
It is important to remember that this simulation was carried out at an angle of attack of 15 degrees. This is an extreme value and not representative of typical flight conditions. Changing the design to reduce stalling in this range could sacrifice performance in its regular operating range.
In fact, the stall characteristics of this drone could be considered beneficial. We observed that flow separation occurred only on the outsides of the wings, while the centre maintained attached flow. This is indicative of a gradual onset of stall, which can make the drone easier to fly at the limit.
These considerations will vary with different applications. A commercial drone will have many different design priorities than a carbon fiber racing drone, for example.
When you are evaluating your own aircraft design, remember to consider the simulation conditions used. Ensure they are realistic of the expected operating conditions of your drone. If you lack access to simulation software, consider using Airshaper. Airshaper provides complete simulation services, including detailed reports to help you meaningfully interpret your results.