The coefficient of drag is a common metric used in aerodynamics. But what does it mean, how can you measure it, and how can you use it to optimise aerodynamic performance?
The definition of drag
The Drag Coefficient Cd quantifies the resistance of an object relative to its frontal area as it moves through a fluid. It allows aerodynamicists to model the influence of shape, inclination and flow conditions on aerodynamic drag. As the coefficient of drag is dimensionless, aerodynamicists can easily compare different designs to determine which has the best aerodynamic efficiency.
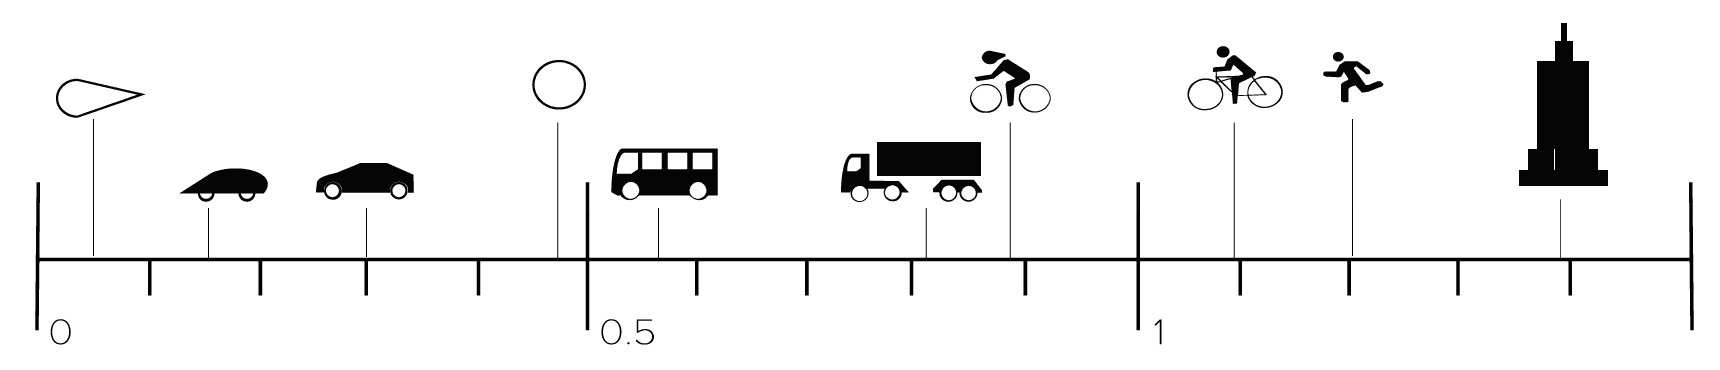
Imagine a teardrop-shaped object, as fluid flows around it, it remains attached to the surface, resulting in minimal drag. This shape of object can have a Cd value as low as 0.05. Whereas, a flat plate perpendicular to the flow creates a large turbulent wake and increases the drag to 1.1 [1].
The drag formula
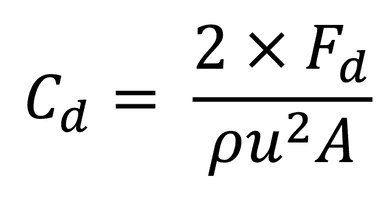
The equation below calculates the drag force on an object as it moves through a fluid.
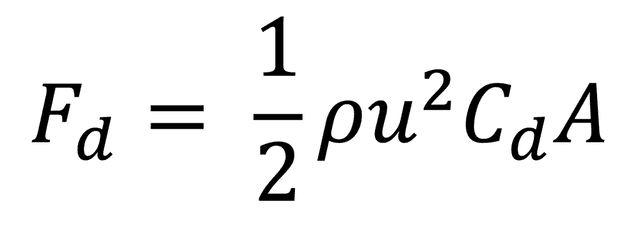
Where: Fd = drag force (N), ρ = density (kg/m³), u (or v) = velocity (m/s), Cd = drag coefficient, A = frontal cross sectional area (m²)
If you know the drag force and speed of the object, you can rearrange the above equation to calculate the Cd. You can then use this to predict the drag force for different flow velocities and object sizes.
Calculating the drag coefficient of an airfoil
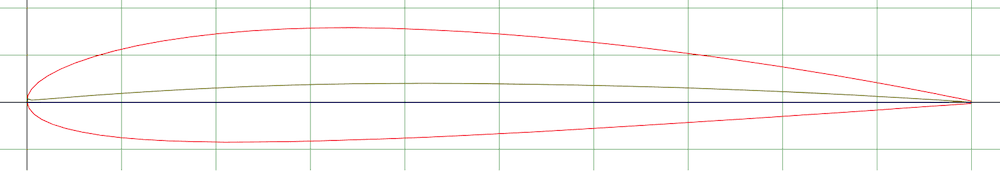
Let’s work through an example and calculate the drag of a small airfoil with a frontal area of 0.5m². In the wind tunnel, the NACA 2412 airfoil generated around 1.505N of drag at 10m/s. The temperature during this test was 20degC (60degF) and the pressure was 1atm, which results in an air density of 1.204kg/m³. Using the drag force equation, we can calculate the drag coefficient.
First, rearrange the drag force equation to give the drag coefficient equation and solve for Cd:
Next, plug in the given values for drag force (Fd), density (ρ), velocity (u) and frontal area (A):

Now we can calculate what the drag would be for the full size airfoil with a frontal area of 10 m²:

How to use drag coefficients correctly
Drag coefficients are a useful metric for comparing the aerodynamic efficiency of different designs. You can also use it to scale the drag force for various object sizes and flow velocities. However, you must be careful when extrapolating data for different speeds and densities.
It is important to remember that drag varies with Reynolds number. The Reynolds number defines the ratio between the inertial forces and the viscous forces of a fluid. It is a dimensionless quantity that describes how the behaviour of air changes with temperature, pressure, velocity and fluid type.
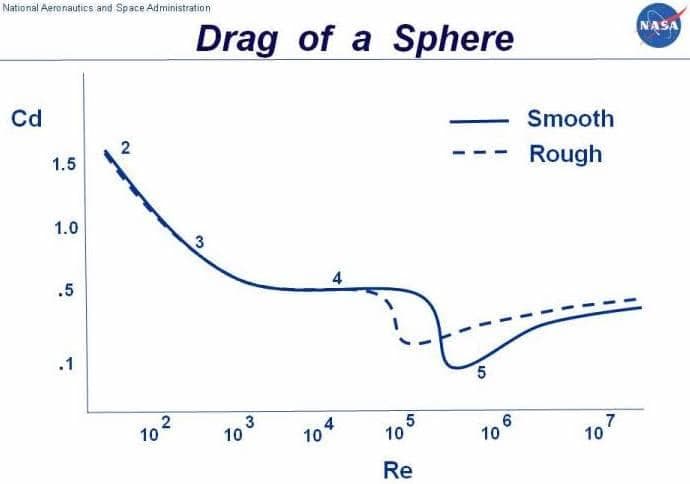
Therefore, to calculate representative drag coefficients, the Reynolds number in experiments has to match reality. This is because skin friction drag depends on the viscous interaction between the object and the flow. So if the Reynolds number is not accurately modelled, then the effects of the viscous forces relative to the inertial forces will be unrealistic.
Another important factor to consider is the compressibility effect of air. At low air velocities, such as 85m/s (190mph) or approximately 0.25 Mach, the compressibility effects of air are almost non-existent. However, at higher speeds closer to the speed of sound, the Mach number in experiments needs to match the real world.
The Mach number is the ratio of air velocity to the speed of sound. At supersonic air flow speeds, shock waves create a significant amount of wave drag, increasing the total drag. Whenever you extrapolate a drag force, you need to ensure that the Reynolds number and Mach number of experiments represent reality.
Comparing drag coefficients
Drag coefficients allow us to compare the aerodynamic efficiency of anything from a car to a building. The Toyota Prius has a Cd of around 0.24, while a bus has a Cd between 0.6-0.8 [3].
You can even compare the drag coefficient between animals. A typical bird has a Cd of approximately 0.4, while a cow's Cd is around 0.5 [4].
| Type of object | Drag coefficient (Cd) | Frontal area |
|---|---|---|
| Dolphin | 0.0036 | Wetted area |
| Subsonic transport aircraft | 0.012 | -0.018 |
| Supersonic fighter (M=2.5) | 0.016 | |
| Toyota Prius, Tesla Model S | 0.24 | Frontal area |
| Sports car with sloping rear | 0.2 - 0.3 | Frontal area |
| Bird | 0.4 | Frontal area |
| Sphere | 0.5 | |
| Bicycle drafting behind another cyclist | 0.4 | 0.36m² |
| Open top convertible | 0.6 - 0.7 | Frontal area |
| Bus | 0.6 - 0.8 | Frontal area |
| Bicycle | 0.9 | |
| Truck | 0.8 - 1.0 | Frontal area |
| Person standing | 1.0 - 1.3 | |
| Ski jumper | 1.2 - 1.3 |
Drag coefficients are not only useful for comparing different objects, but also different designs of the same object. Drag significantly affects a vehicle's fuel consumption or battery range. Therefore, aerodynamicists use drag coefficients to compare and optimise the shape of the bodywork to minimise drag. This also ensures that only optimised designs are tested in the wind tunnel, reducing development time.
In fact, this is precisely what Formula 1 teams do. Before testing a design in the wind tunnel, aerodynamicists run hundreds of different iterations through CFD simulations first. This helps them identify the designs with the most potential to gain aerodynamic performance. These are then transformed into scale models for wind tunnel testing, with the best developed into upgrades for the car.

How to measure drag
To accurately measure drag, there are a variety of force measurement techniques that are typically used in the wind tunnel. However, if wind tunnel tests are too expensive, then you can measure the drag yourself with a coast down test. The automotive industry commonly uses this as a relatively simple way to measure the mechanical and aerodynamic resistance of a vehicle.
During a coast down test, the driver accelerates the vehicle to a set speed and then engages the clutch. The vehicle then slows or ‘coasts’ down in neutral due to two main forces acting on the vehicle. The first is the mechanical force of the drivetrain, such as friction in the axles, bearings and so on. The second is the force of air resistance such as drag.
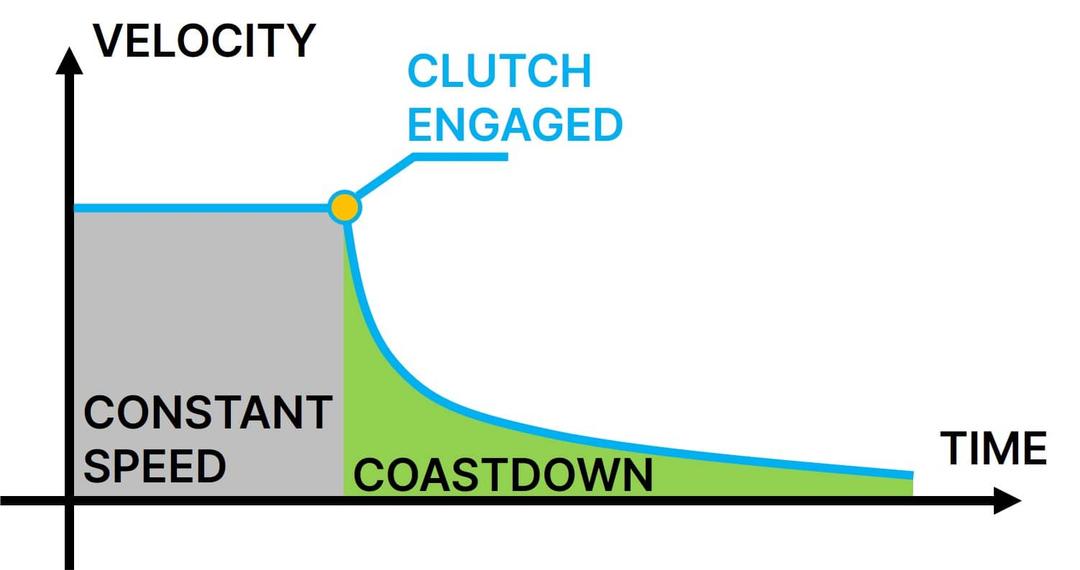
You can then use the distance travelled and the time taken during the test to calculate aerodynamic drag. By conducting back-to-back coastdown tests between different vehicle configurations you can estimate the drag of new features such as a rear wing.
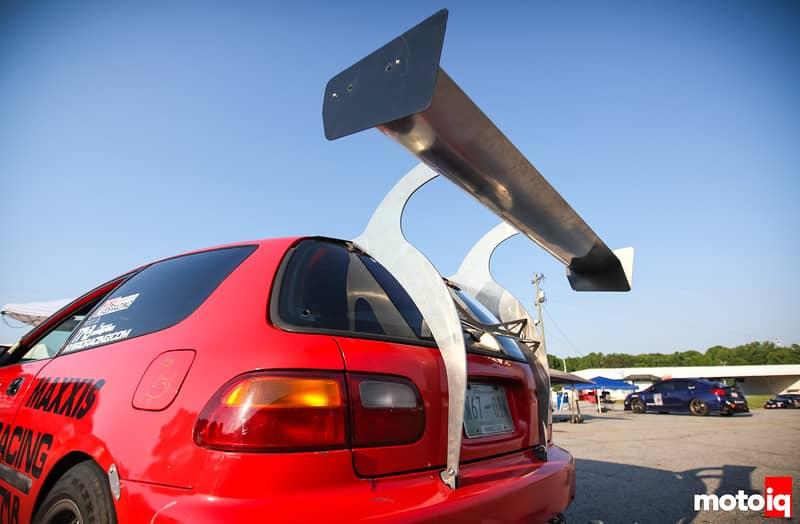
To do this you first need to conduct the coastdown test without the rear wing. Note the top speed and the distance (or time) taken to come to a complete stop. Next, attach the rear wing and repeat the test at the same top speed and the car should come to a stop sooner. Plot the speed over time (or distance) and the area under the curve equates to the total drag force.
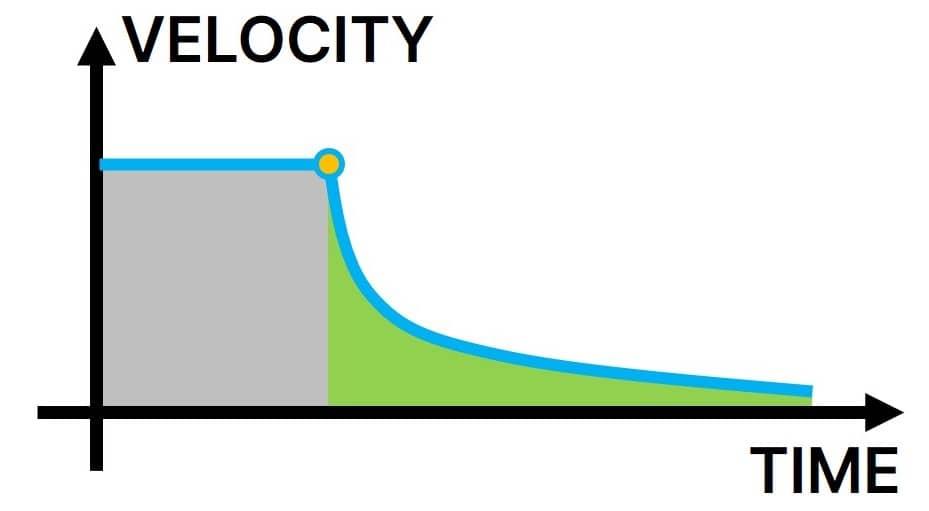
The difference between the two runs represents the total drag force of the new wing. You can then use the drag equation, as explained above, to calculate the drag coefficient of the wing. Provided the shape remains the same, you can also calculate the drag for different wing sizes.
Drag coefficients in industry
Drag coefficients allow aerodynamicists to analyse the aerodynamic efficiency of an object, regardless of its size or velocity. This means that you can compare the aerodynamics of a car with a bird. Although extremely different, they both have a normalised drag coefficient.
Drag coefficients are an essential consideration throughout the design process of any object that interacts with a fluid. When determining which design has the highest performance, engineers can rank them in order of drag coefficients. Alternatively, aerodynamicists can take inspiration from other aerodynamic shapes with low drag coefficients – no matter what industry they come from. For example, Mercedes once designed a roadcar inspired by the hydrodynamics of a fish!
References
[1] 2018. What is a drag coefficient? [Online]. AirShaper.
[2] 2021. Analysis of various NACA airfoil and fabrication of wind tunnel to test the scaled-down model of an airfoil [Online]. IOP Conference Series: Materials Science and Engineering.
[3] 2004. Drag coefficient? [Online]. The Engineering ToolBox.
[4] 2021. What is the average drag coefficient of a cow? [Online]. 3D Comparison.