A virtual wind tunnel is a computer simulation of a wind tunnel test. A 3D model of a car, aircraft, bike or any other object is placed in a digital flow domain, and computational fluid dynamics (CFD) calculates how air flows around it. The result is the information a physical test aims for, such as drag, lift and downforce, together with the pressure and velocity at every point of the flow around the object.
Because nothing has to be built, a virtual wind tunnel can test a design at the concept stage and compare variants under identical conditions. In practice it is used to explore and narrow down designs, while physical tests are used to correlate the simulation and confirm the final result.
How a virtual wind tunnel works
A physical wind tunnel moves air past a fixed model and measures what happens with a force balance, pressure taps and flow visualization. A virtual wind tunnel replaces each of those with a numerical equivalent. The process has four stages: geometry, mesh, solve and post-process.
1. Geometry and flow conditions
Everything starts with a 3D model: production CAD, an early surface model from the design studio, or a 3D scan of an existing object. The simulation can only be as faithful as that model. Details such as panel gaps, rivet heads or a missing internal duct change the local flow and, with it, the forces.
Next come the conditions of the test:
- Flow speed and fluid. The fluid is defined by its density and viscosity. Air is the usual case, but the same method applies to water.
- Orientation: the yaw, pitch and roll of the model relative to the oncoming flow.
- Ground. For road vehicles, a ground moving at flow speed and rotating wheels reproduce the road rather than a tunnel floor.
- Special elements such as rotating propellers, radiators that resist the flow, or inlets and outlets where air enters or leaves the model.
A virtual wind tunnel is not limited by the size of a test section. Its boundaries can be placed as far from the model as needed, so they do not disturb the flow around it, and no supports are needed to hold the model in place.
2. Meshing
The space around the model is divided into millions of small cells, a step called meshing or discretization, and the equations are solved for each cell. As with pixels in a digital photo, smaller cells capture more detail but cost more computing effort.
A good mesh puts its resolution where the physics needs it:
- Near the surface, where the boundary layer forms. Thin, stacked cells called prism layers follow the surface to capture how the flow slows down against the wall and where it separates.
- In wakes and vortices, and wherever pressure changes sharply.
- Far from the model, where the flow is nearly undisturbed and cells can be large.
The difficulty is that you do not know in advance where the flow will be complex; that is what the simulation is for. Adaptive mesh refinement addresses this by solving first on a coarser mesh, locating the regions with strong gradients, refining the mesh there and solving again.
Mesh resolution has a direct effect on the answer. A mesh that is too coarse can smear out a vortex or move a separation point, which changes drag and lift. Checking that the results stop changing meaningfully when the mesh is refined further is a standard part of reliable CFD.
3. Solving
The solver computes the flow by iterating on the Navier-Stokes equations, which express conservation of mass and momentum, for every cell until the solution settles.
Turbulence is the main modeling decision. Resolving every turbulent eddy around a full vehicle is far beyond practical computing budgets, so most engineering simulations use the Reynolds-averaged Navier-Stokes (RANS) approach: the solver computes the time-averaged flow and represents the effect of turbulence with a turbulence model. The k-omega SST model is a common choice for external aerodynamics because it was designed to handle boundary layers approaching separation.
A simulation has converged when the monitored quantities, typically the forces, stop drifting. Forces often keep oscillating around a mean, so results are averaged over a window once convergence is reached.
Two types of simulation are common. A steady-state simulation gives a time-averaged view of the flow and suits most aerodynamic studies. A transient simulation follows how the flow develops over time, which is needed for unsteady phenomena such as vortex shedding or an oscillating wake.
4. Post-processing
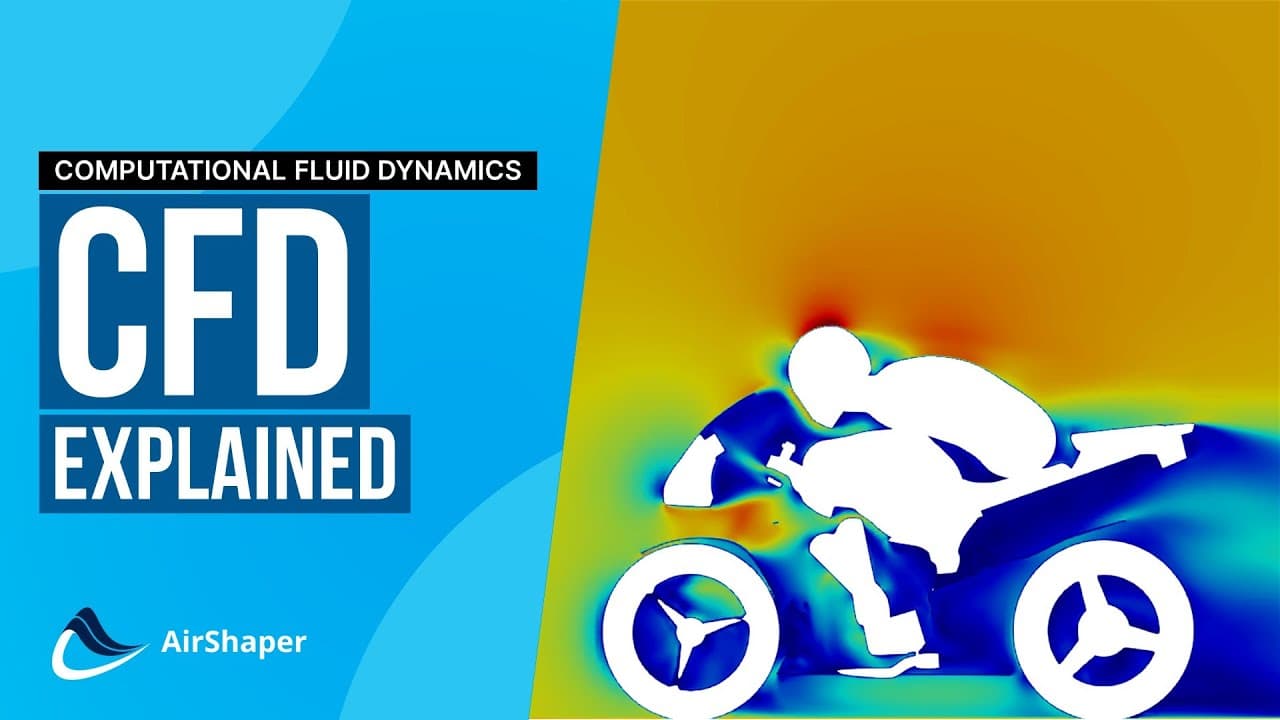
Once the solution has converged, velocity and pressure are known in every cell. Forces come from integrating pressure and friction over the model's surface: add up the surface pressure on the upper and lower side of a wing, each multiplied by the area it acts on, and you have the wing's lift.
What a virtual wind tunnel tells you
Forces, coefficients and moments
- Drag, the force that resists motion, made up of pressure drag and friction drag. It is usually reported as a drag coefficient (Cd), or as drag area (CdA) when the reference area is not well defined.
- Lift, or downforce when it pushes a vehicle onto the road. For a race car, the front-to-rear split of downforce, the aero balance, matters as much as the total.
- Side force and moments in pitch, roll and yaw, which govern stability. EIVA used these moments to rebalance a towed survey frame before taking it to sea.
- Performance of individual elements, such as the thrust, torque and power of a propeller.
- Flow rates through radiators, together with the pressure drop across them, which show whether the inlets and ducts feed enough air to the cooling system.
Because the whole surface is resolved, forces can also be broken down per component, which shows which parts of a design produce most of the drag or downforce.
Pressure and flow structures
The forces tell you how a design performs. The flow field tells you why:
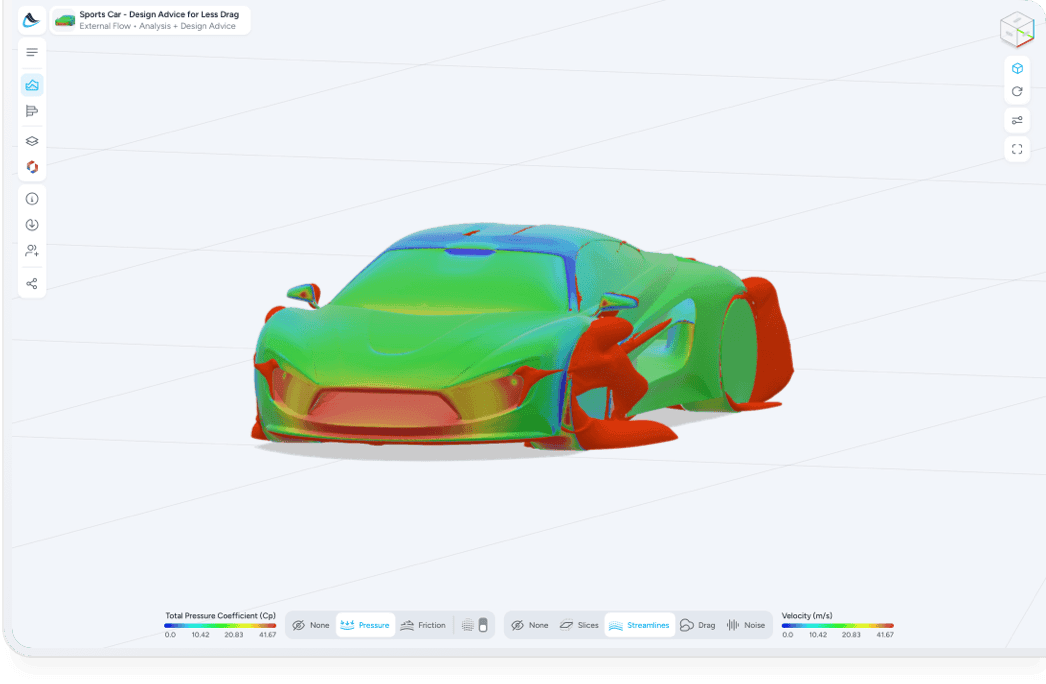
- Surface pressure shows where the flow stagnates and pushes on the model, and where it accelerates and pulls.
- Surface friction shows where the flow stays attached to the surface and where it separates.
- Streamlines trace the path of the air around and behind the model.
- Slices through the flow show velocity or total pressure in a plane, for example across the wake behind a vehicle.
- Pressure clouds, surfaces where the total pressure coefficient equals zero, outline in 3D the wakes and vortices where the flow has lost energy.
In a physical tunnel, seeing part of this takes smoke, pressure rakes or particle image velocimetry, and only where the instruments are placed. In a simulation, every point in the field is available. How to interpret CFD results walks through reading these plots on a real analysis.
Where caution is advised with a virtual wind tunnel
A virtual wind tunnel is a model of the physics, and its results carry the assumptions of that model:
- Turbulence modeling. RANS turbulence models are calibrated approximations. They are generally dependable for attached flow and for comparing design variants, and less certain where the flow separates over large areas, where the boundary layer changes from laminar to turbulent, or where the flow is strongly unsteady. For strongly unsteady flow, AirShaper's transient simulations are the answer: they follow how the flow develops over time instead of averaging it.
- Mesh sensitivity. Absolute values depend on mesh resolution, especially near the surface and in separated regions.
- Geometry and setup. A simulation tests the 3D model, not the part that will be built. Surface finish, manufacturing tolerances and deformation under load are not included unless they are modeled.
- One run per configuration. Every change in speed, angle or geometry needs a new mesh and a new run, whereas a physical tunnel can sweep through a range of angles continuously.
Physical tests have their own limitations: blockage and wall effects in the test section, supports in the flow, moving belts that cover only part of the floor, and scale models that cannot always match the full-scale Reynolds number. Both methods carry errors, which is why the most useful question is often a relative one: is design B better than design A, and by how much.
The two methods are complementary. After comparing CFD with wind tunnel data for its fixed-wing drone, Wingtra concluded that CFD would not replace wind tunnel or flight testing, but that its relative importance would keep growing.
Benchmarking company A2MAC1 tested a Tesla Model Y in the S2A wind tunnel and compared it with an AirShaper simulation of a 3D scan of the same car. The simulation predicted a CdA 5-6% higher than the tunnel, which the authors attribute partly to air curtain ducts missing from the scan and partly to the tunnel's narrow moving floor. The total pressure distribution 100 mm behind the car had a very comparable global shape in both. More comparisons, for cars, aircraft, drones, propellers and internal flows, are collected on the validation page.
For a fuller comparison of the two approaches, see CFD vs wind tunnel testing. For the physical side, how a wind tunnel works explains how tunnels condition and measure the flow.
Where virtual wind tunnels are used
- Cars, trucks and buses. Lower drag for less fuel consumption or longer EV range, and efficient cooling inlets and ducts. Aptera combined early CFD with AI Morphing to reduce the drag of its solar electric vehicle.
- Motorsport. Downforce, aero balance and how both change with ride height. See race car aerodynamics.
- Motorcycles. Bike and rider act as one shape. See motorcycle aerodynamics.
- Aircraft, drones and eVTOLs. Lift-to-drag ratio for range, stability in pitch, roll and yaw, and the interaction between propellers and airframe. Wingtra used simulation in the development of its drones.
- Sports. Athletes and their equipment, from cycling to high-speed skiing.
- Buildings and offshore structures. Wind loads and turbulence, for example the airflow over an offshore helideck.
- Water. The same equations apply in water, for underwater vehicles, hydrofoils, submerged structures and towed bodies.
The case studies cover these applications in more detail, and the sample simulations let you explore complete results.
How AirShaper runs a virtual wind tunnel
AirShaper is a cloud-based virtual wind tunnel: it runs CFD simulations on your 3D models from a web browser, without high-end hardware or a CFD specialist. You upload the design and set the flow conditions, and the platform handles meshing, solving and post-processing. Mapped onto the four stages above:
- Geometry. Upload STL, OBJ, STEP or IGES files, or import directly from Onshape. Complex, non-watertight models can be used as they are, without CAD repair or simplification. Rotating wheels, propellers, radiators, inlets and outlets, tire compression, ride height, viscosity, density and surface roughness can be added to the setup.
- Mesh. Meshing is automated. Three prism layers are added at the surface to resolve the boundary layer and capture flow separation. Every simulation includes adaptive mesh refinement: it starts at half the target cell count, then refines locally based on pressure gradients and flow vorticity, both in the volume around the model and on its surface. AirShaper has published part of this code as open source.
- Solver. Simulations run on OpenFOAM, either as steady-state RANS with the k-omega SST turbulence model, which suits most cases, or as transient simulations that follow how the flow develops over time, for unsteady flows. Convergence is detected automatically from the forces, and the averaging window adjusts to how much the flow oscillates.
- Results. Interactive 3D results in the browser, including pressure clouds, surface pressure and friction, and streamlines, alongside forces, drag and lift coefficients, aero balance and pitch, roll and yaw moments. Reports and the underlying OpenFOAM data can be downloaded for further post-processing in ParaView. Explore complete results in the sample simulations, or open a transient simulation of the Sendycar, in its 2026 Pikes Peak spec.
Because the setup is standardized rather than built by hand, every variant of a design is simulated the same way, which matters when the goal is the difference between two designs.
Beyond analysis, Design Advice runs an adjoint simulation that shows where reshaping the model would have the most effect, and AI Morphing reshapes the model automatically within a defined design space, toward a drag or lift target. Thermal simulations are coming to AirShaper as well. Heat transfer is hard to measure in a wind tunnel: it takes heated hardware, controlled air temperatures and sensors at chosen points, while a simulation shows temperatures across the whole model.
Some features, including transient simulations, reports, data downloads, Design Advice and Morphing, depend on the plan. The product page covers the full feature set.