The short answer
A wind tunnel measures the forces on a real, physical model in real air, but inside a facility that adds effects of its own: walls, model supports, a fixed or partly moving floor and, for scale models, often a lower Reynolds number than the full-size object sees. CFD (computational fluid dynamics) computes the flow around a digital model in unconfined, road- or flight-like conditions and shows the entire flow field, but its accuracy depends on the mesh, the turbulence model and how closely the digital geometry matches the real one. In practice the two are complementary, and AirShaper recommends using both. A tunnel test is often used to validate the CFD: once the simulation is shown to match the measurements, development can continue in CFD on results you can trust, exploring many variants and showing why they behave as they do, with the tunnel or another physical test confirming the final design.
Below, the two methods are compared side by side, followed by what AirShaper's nine published validation studies show about the gap.
How wind tunnel testing works
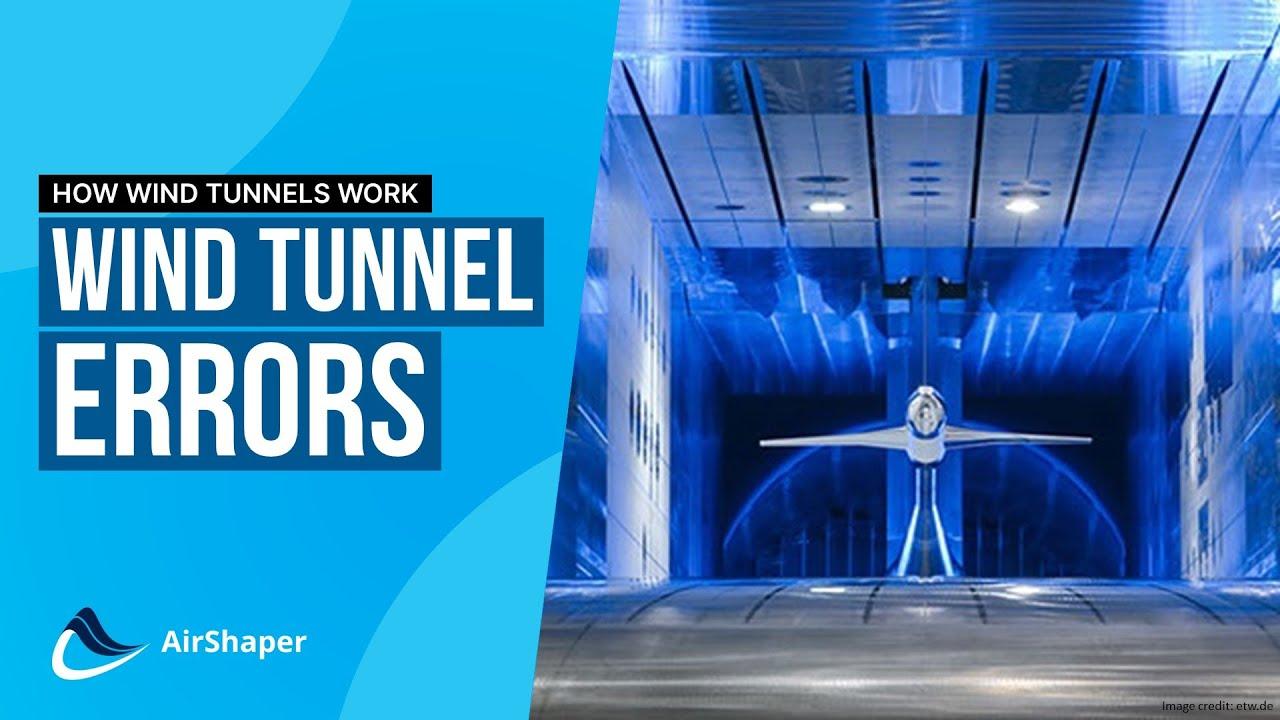
A wind tunnel turns the problem around: instead of moving an object through still air, it moves conditioned air over a fixed model. In the common closed-loop layout, a fan drives the air around a circuit, a honeycomb and mesh screens straighten it and reduce turbulence, and a contraction accelerates it into the test section. The wind tunnel explainer and the test section video go through each part.
What a tunnel measures depends on its instrumentation (see the measurement techniques video):
- Forces and moments from a balance: lift, drag, side force and the pitch, roll and yaw moments. Automotive tunnels can also have load cells under the wheels or the rolling road to split the downforce between front and rear.
- Surface pressure from pressure taps built into the model, at discrete points.
- The flow itself, from probe rakes in the wake or from Particle Image Velocimetry (PIV), which measures velocity in a laser-lit plane without putting hardware in the flow.
- Flow visualisation with wool tufts, smoke or flow-vis paint, showing where the flow stays attached and where it separates.
To see a full test day in a real facility, watch our visit to the S2A wind tunnel, the tunnel used in the Tesla Model Y study below: setting up a Porsche 911, calibration, acoustic tests, drag measurement and flow visualisation.
Full-size facilities exist, such as NASA's 80 x 120 ft tunnel at Ames, which takes a full-size fighter aircraft, but most testing uses scale models, typically 10-50% of full size. That brings in the Reynolds number: to keep it the same on a model X times smaller, the wind speed has to go up X times, or the air density or viscosity has to change. Fan power and compressibility limit the speed, so many scale tests run below the full-size Reynolds number, and boundary layer transition and separation are sensitive to exactly that.
Where tunnel data needs care
- Blockage and walls. The walls confine the flow, so it speeds up around the model. The effect grows with the blockage ratio, the model's cross-section over the test section's, and has to be corrected for; the usual recommendation is to keep it below 5-10%. The walls also carry boundary layers of their own (see the scale model testing article).
- Supports. Struts, stings and wheel restraints generate drag and lift of their own and disturb the flow around the model, so their effect has to be measured and subtracted.
- The ground. On the road, the ground moves relative to the car and the wheels rotate. Tunnels approximate this with moving belts, sometimes only a narrow one between the wheels, and how much of the floor moves changes the underbody flow. In the Tesla Model Y study, the S2A belt ran only between the wheels while the simulation moved the whole floor: the largest wake differences were close to the ground, and A2MAC1 names the narrow belt as one reason the tunnel measured less drag.
- Model fidelity. A scale model can be cleaner and stiffer than the real object, without its rivet heads, panel gaps and flexing structures.
- Facility dependence. As A2MAC1 notes in the Tesla Model Y study, each tunnel has its own setup, so comparisons within one tunnel work, "but things get tricky when comparing with data from another tunnel or simulation data."
How CFD works
CFD solves the Navier-Stokes equations of fluid motion numerically: the space around a digital model is divided into a mesh of small cells, and the solver computes velocity and pressure in each of them until the solution converges (see the CFD explainer video).
Turbulence is the hard part. Resolving every eddy around a complete vehicle is out of reach for engineering work, so most industrial CFD uses RANS (Reynolds-averaged Navier-Stokes), which solves for the time-averaged flow and represents turbulence with a model. Scale-resolving methods such as LES and DES capture more of the unsteady turbulence, at a much higher computational effort. AirShaper runs steady-state RANS with the k-omega SST turbulence model in OpenFOAM, with adaptive mesh refinement and automatic convergence detection. For unsteady flows, such as vortex shedding or oscillating wakes, AirShaper also offers transient simulations, which capture how the flow develops over time.
What CFD gives you that a tunnel cannot is the complete field: pressure, velocity and wall shear everywhere, which you can inspect after the run to find where the drag comes from, where the flow separates and how the wake forms. The boundary conditions are also yours to choose: in the Tesla Model Y study, the simulation had rotating wheels and a floor moving across its full width, with no support arms.
Where CFD needs care
- Turbulence modelling. Steady RANS is on firmest ground in attached flow and moderate separation. Massive separation, stall onset, vortex breakdown and strongly unsteady wakes are harder, and different turbulence models can disagree there. Standard RANS models also do not predict laminar-to-turbulent transition unless a transition model is added, which matters most at low Reynolds numbers. That is why AirShaper's validation studies also cover high angles of attack, into and past stall: the Cessna 210 against NASA data up to 24°, the Wingtra drone up to 15° and the University of Sydney fighter jet up to 30°. They quantify the gap in exactly these conditions, so you know what error to expect there (see what the studies show).
- Mesh resolution. Results change with cell size until they stop changing, and the near-wall prism layers that resolve the boundary layer matter most where friction dominates. AirShaper's adaptive mesh refinement is built to deal with this: it adjusts the mesh resolution locally to the flow around each geometry, and convergence is detected automatically, so the result does not depend on a mesh someone set up by hand. In the Cessna study, DARcorporation had to mesh the model and run a mesh convergence study themselves for the two other codes; AirShaper automated that step. See also choosing a simulation resolution.
- Geometry. The simulation sees only what is in the CAD or scan. A missing duct, seam or vortex generator is missing from the result too.
- Idealised inflow. The incoming wind is uniform and steady at a set turbulence level, which neither the road nor every tunnel matches.
Wingtra summed up both sides in their drone validation:
Neither wind tunnel nor CFD are perfect: prototypes can (and will) have non-perfect surface finishing and there are balance measurements errors. Similarly simulations have uncertainty with modeling, discretization and iteration errors.
Side-by-side comparison
| Aspect | Wind tunnel | CFD |
|---|---|---|
| Model | Physical part at full size or scale, with its real surface finish and details, or a cleaner, stiffer scale model | Digital CAD or scan, with only the details that are in the file |
| Flow physics | Real air: turbulence, transition, unsteadiness and separation are all present | Turbulence is modelled; steady RANS gives the time-averaged flow, a transient simulation how it develops over time |
| Boundary conditions | Walls, supports and a fixed or partly moving floor, which need correcting or accounting for | Unconfined flow, fully moving ground, rotating wheels and no supports, with idealised inflow |
| Reynolds number | Matches full scale only at full size, or by raising pressure or speed within the facility's limits | Set directly to full-scale conditions |
| Forces | Measured directly by the balance | Integrated from the computed surface pressure and friction, and can be split per part |
| Flow insight | Where you can see or reach: tufts, smoke, paint, pressure taps, probe rakes, PIV planes | Pressure, velocity and shear everywhere, inspectable after the run |
| Iteration | Each shape change needs a new part and tunnel time; attitude sweeps (yaw, ride height, angle of attack) are quick once the model is installed | A shape change is a new file; many variants can run side by side, and each sweep point is another run |
| Main error sources | Balance accuracy, blockage and support corrections, Reynolds mismatch, model fidelity | Turbulence model, mesh resolution, convergence, geometry fidelity |
| Strongest at | Confirming numbers on a physical object; strongly separated or unsteady flow; aeroacoustics | Exploring a design space; showing why a design behaves as it does; conditions a tunnel cannot reproduce |
How close does CFD get? Nine validation studies
AirShaper has nine published validation studies. Eight are credited to engineers outside AirShaper; the ninth, on VECTO, is AirShaper's own. Five compare AirShaper with wind tunnel measurements, two with test benches for internal flow, one with another CFD workflow and one with the EU's CFD validation procedure for trailers. Results are reported as percentages, as curves or as a pass against an error band, so there is no single accuracy figure; the table gives each result as the study states it.
| Study | Reference | What was compared | Result, as reported |
|---|---|---|---|
| Tesla Model Y (A2MAC1) | S2A wind tunnel, real car; moving belt between the wheels, rotating wheels | CdA; total pressure in a plane 100 mm behind the car | CdA 5-6% higher in CFD, which A2MAC1 attributes in part to air-curtain ducts missing from the scan and to the tunnel's narrow moving floor. Wake: global shape "very comparable", largest differences near the ground |
| Cessna 210 (DARcorporation) | NASA data from the Langley full-scale wind tunnel; two other CFD codes run alongside | Lift, pitching moment and drag coefficients against angle of attack | No single figure. On average, AirShaper's curves were the closest of the three codes to the tunnel data: most clearly for lift, while STAR-CCM+ came closer on drag at low angles. Pitching moment slopes matched closely for all three. AirShaper was the only code run past 16°, up to 24°; it and STAR-CCM+ predicted an earlier stall than measured. Results "within the range they would expect from their normal tools" |
| Wingtra fixed-wing drone | Wind tunnel, drone on a measuring balance; data corrected for air density, blockage and the mounting structure | Lift and drag curves | No single figure; "a very good correlation between the wind tunnel data and the CFD simulations" |
| Mejzlik propeller | Wind tunnel at the University of Defence, Brno; 21x13 propeller on a test stand at 4900 RPM, open test section | Thrust coefficient, power coefficient and efficiency against advance ratio J | Regular simulation with prism layers: "near-exact match" over J 0.0-0.6; thrust coefficient 101%, 100%, 103% and power coefficient 107%, 102%, 105% of the measured value at J 0.2, 0.4 and 0.6. Above J 0.6, near the windmilling point, the tunnel measurements suffered from blockage, so the two diverge |
| SSAM-Gen5 fighter jet | Subsonic wind tunnel at the University of Sydney, balance measurements at 20 m/s; existing CFD database | Lift, drag, pitching moment and aerodynamic efficiency up to 30° angle of attack | No single figure; "an extremely good correlation with wind tunnel data and the existing CFD database". Large CFD-to-experiment spread at high angle of attack, which the author links mainly to the sensitivity of pitching moment; a 0° pitching moment offset in the tunnel data is suspected to come from mounting-strut interference |
| evos blood pump | evos test benches at the same flow rate and rotational speed | Pressure rise, power, torque, axial force | Pressure rise +0.6%, power −3.6%, torque −3.7%; axial force "confirmed with very little deviation" |
| Kong Jih ball valves | Physical flow test: upstream and downstream pressure and flow rate | Flow coefficient Cv of two valves at several flow rates | Basic simulation with prism layers, which every AirShaper simulation now includes: 0.9% deviation for valve A (straight passage) at the highest flow rate, about 8% for valve B (contraction and obstruction) across the flow rates tested. Kong Jih's 1D formulae deviated by up to 68% |
| AVL Racing touring car | AVL's conventional CFD workflow; no physical measurement | Drag and downforce; surface pressure and a velocity slice | 5.2% difference in drag, 3.6% in downforce; pressure map "near-identical", flow structures "highly similar" |
| VECTO trailer benchmark (AirShaper) | EU CFD validation procedure for trailer certification: reference geometries with defined error margins | Drag reduction for each geometry (base, long side covers, tall rear flaps) at 0°, 3° and 6° yaw | "Our simulations fall within the required error bands"; the text gives no deviation figure |
What the studies show
- Geometry matters as much as the solver. The Tesla scan lacked the duct connecting the air-curtain inlets and outlets, one reason A2MAC1 gives for the higher simulated CdA. On the Cessna, the simulations, AirShaper's included, predicted stall earlier than NASA measured; seams or vortex generators missing from the 3D model are a possible cause, which the age of the data makes impossible to check.
- The tunnel is not a perfect reference. The S2A belt only runs between the wheels, the propeller measurements suffered from tunnel blockage near windmilling, and the fighter jet's blockage corrections are uncertain for an unconventional aircraft. Wingtra had to correct for air density, blockage and the mount before comparing.
- Separated flow is where agreement is weakest. Stall onset on the Cessna and high-angle pitching moment on the fighter jet are the clearest disagreements, and the fighter jet study notes that RANS turbulence models are "susceptible to large differences in modelling separated flows". Kong Jih's valve B, described as more dependent on flow separation, deviated about 8%, against 0.9% for valve A. Because the studies deliberately went to these conditions, the size of the gap there is measured rather than assumed.
- Resolution and near-wall layers matter. The propeller matched best with the Regular simulation (10 million cells) with prism layers; the Basic one (1 million cells) with layers underpredicted thrust at low advance ratios. Adding prism layers, which every AirShaper simulation now includes, brought valve A to 0.9% at the highest flow rate.
- Trends agree before absolute values do. The Cessna lift slopes matched while the offsets differed, and on the propeller "all methods capture the correct trend". The VECTO procedure, too, checks drag reductions rather than absolute drag.
When to use which
Start with CFD when
- There is nothing to test yet. For DARcorporation, "the majority of work takes place before any physical components or aircraft exist".
- You need to compare many variants. In Wingtra's words, "It's only by running high numbers of simulations that you really start to see trends and find areas for improvement."
- You need to know why. A force change in the tunnel tells you that something changed; the flow field shows where and why.
- The tunnel cannot reproduce the case. A fully moving ground with rotating wheels, internal flows such as pumps and valves, or several propellers interacting with an airframe, which Mejzlik names as CFD's main benefit for its work.
- Testing is restricted. AVL notes that the rules in certain race categories prevent teams from using wind tunnels.
Go to the tunnel, track or test bench when
- You need a measured number for sign-off. Regulation sometimes requires it: under the EU's VECTO rules, real-world road testing is still mandatory for certifying trucks, buses and coaches, while the aerodynamic gains of trailer add-ons can be certified with a validated CFD method alone.
- The flow is dominated by separation or unsteadiness, such as stall, high angles of attack or vortex breakdown, where steady RANS is least certain.
- The real object differs from the CAD. A production car's real shape "can differ quite a lot from the digital mockup produced during development", as A2MAC1 notes.
Road and track testing, such as coastdown tests, add real-world conditions but give up control over wind and temperature; the Catesby Tunnel is one attempt to get both.
Using them together
AirShaper recommends both methods, not one instead of the other. One of the tunnel's most valuable roles is validating the CFD: a test on one design shows how closely the simulation matches, and from then on development can continue in CFD on results you can trust, with the tunnel coming back to confirm the final design. The validation studies above are examples of that first step.
The usual sequence is to explore in CFD, take a short list to the tunnel, and feed what the tunnel shows back into the simulation setup. For a correlation exercise:
- Test the geometry you simulate. Scan the physical object or build the model from the same CAD, as A2MAC1 did by scanning the Tesla Model Y.
- Match the conditions or correct for the differences. Model the tunnel's walls, belt and supports in the simulation, or correct the tunnel data for blockage and mounts as Wingtra did.
- Compare like with like: the same coefficients, reference area and axes, over a sweep of conditions rather than a single point.
- Record the uncertainty on both sides, so the difference can be read against what each method can resolve.
Once the correlation is established, the simulation can carry more of the work. After building test benches to check AirShaper, evos found that "when new variants are developed, random comparative measurements are now sufficient". Wingtra expects CFD "will not replace wind tunnel testing or flight testing all together but for sure its relative importance will grow".